This page collects the weekly blog posts written by students over the course of fieldwork during the Fall 2025 field season. These blog posts detail each of our weekly labs, including student summaries, reflections, photographs, data, and interpretations.
Posts appear in descending chronological order, with the most recent post appearing at the top of the page.
Fall 2025 Field Season
Week 10 – Community Archaeology Day!
Created by Kyle Reisinger and Cristian Castillo
Introduction:
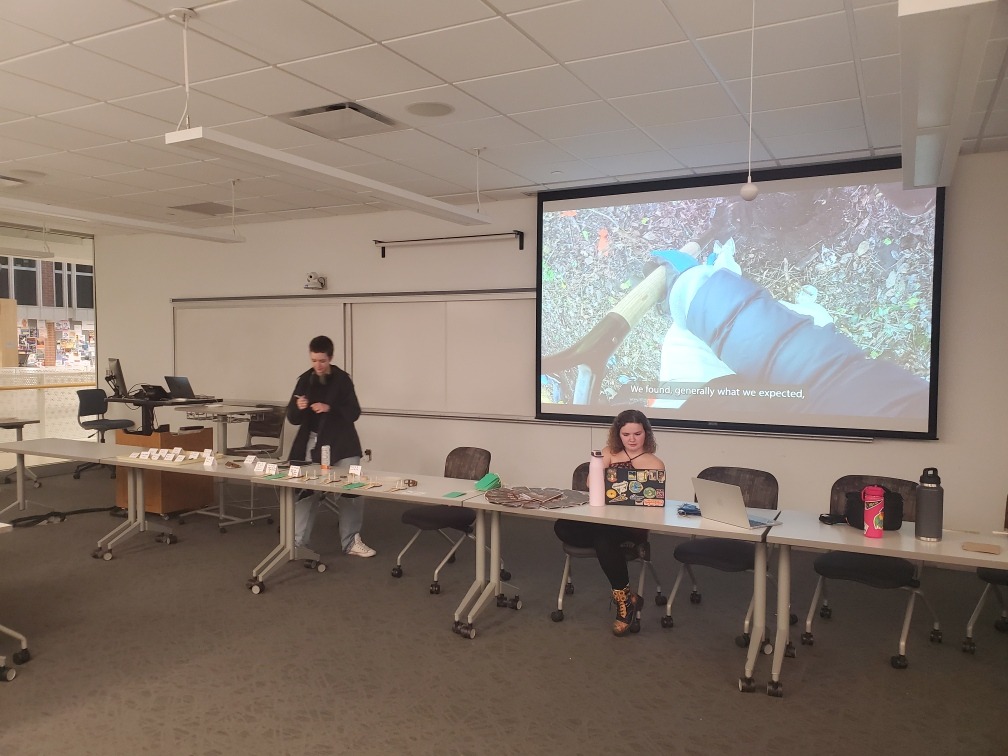
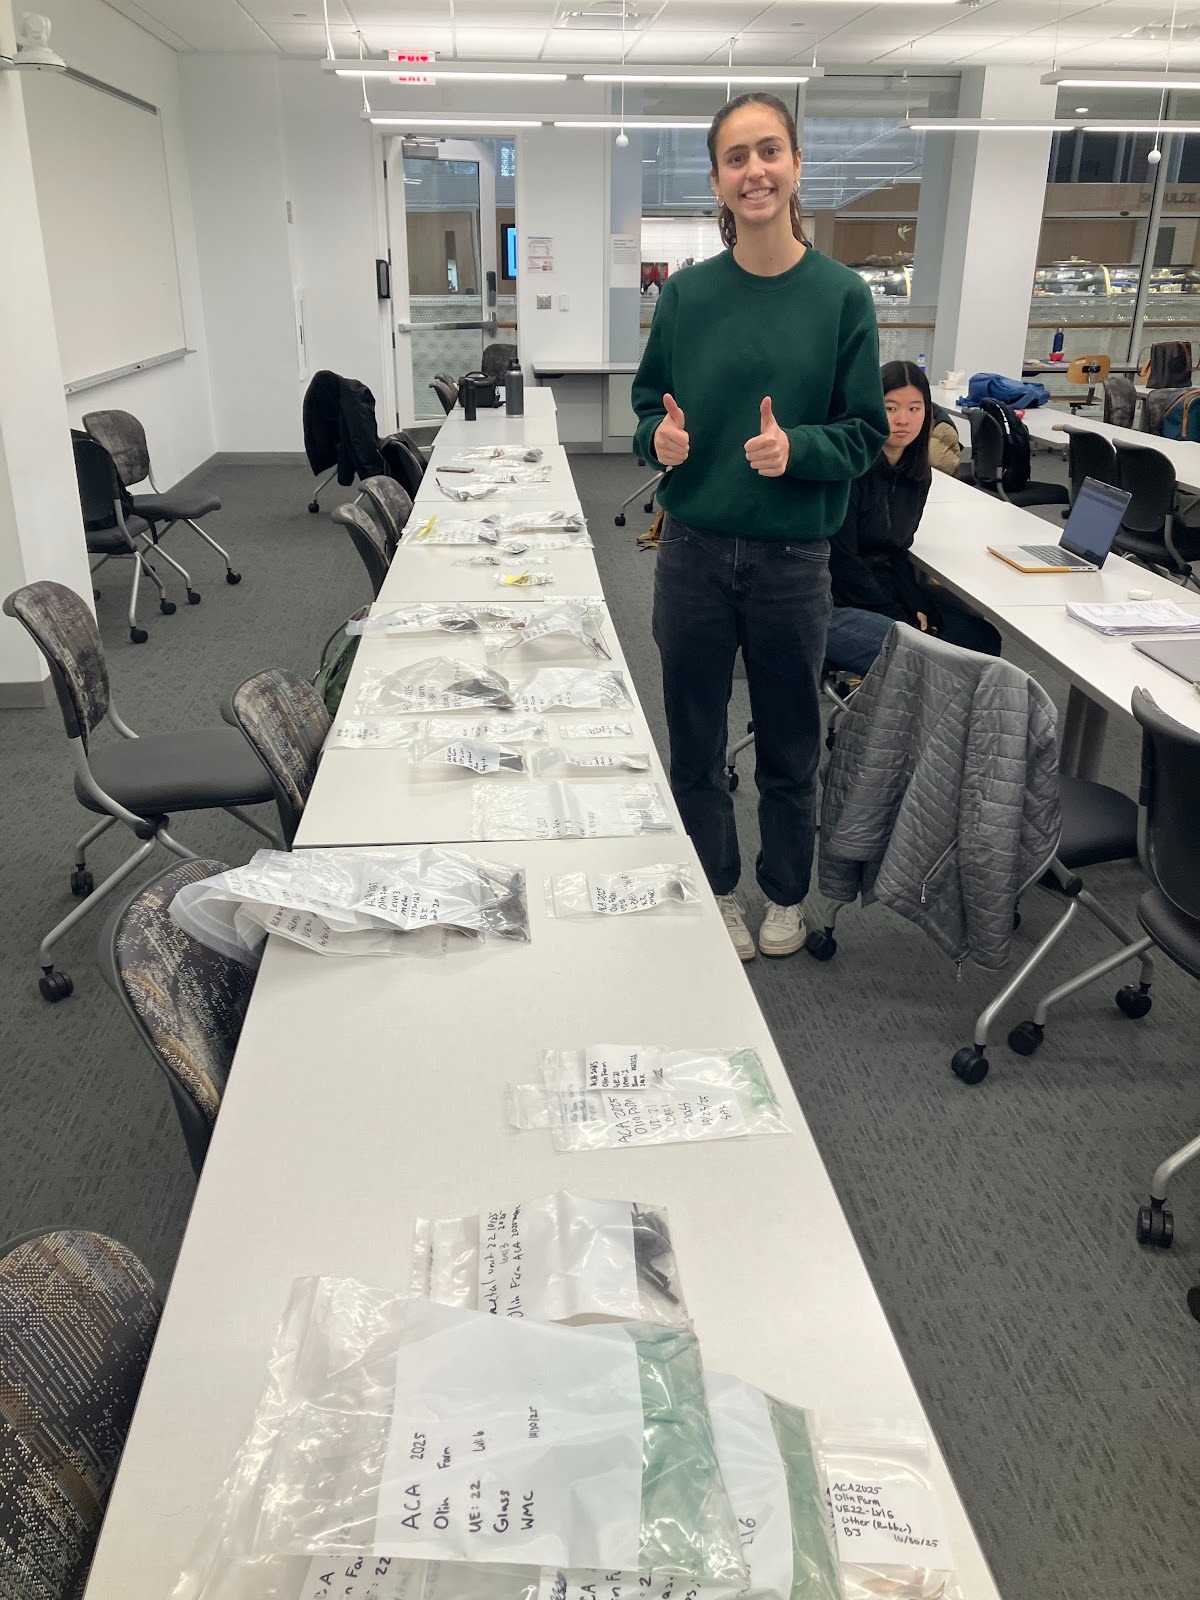
In the final week of our course, we were able to come together in the Anderson atrium in order to present our research to the Carleton and broader Northfield communities during our Community Archaeology Day. At this event, we were able to convey all that we have learned, from archival research to excavation, throughout the duration of Archaeological Methods & Lab.
The primary focus for this course in fall 2025 was the Olin Farm site. This event allows us to inform the community about archaeology, including our research and excavation methods, the tools and equipment used in archaeology, along with counting, bagging, cataloguing, and labelling artifacts that were found at the site.
Event Summary
For Community Archaeology Day, the Anderson classroom was used to display the range of equipment used out in the field, along with a video documenting our experiences and interactions with archaeology, which can be helpful for individuals who are not too familiar with the topic. It was also used to display additional artifacts that people were welcomed and encouraged to view, along with some light refreshments for our guests. Out in the Anderson atrium, various groups displayed posters and artifacts that related to their individual research topics, which they shared with individuals coming to experience Community Archaeology Day.
For this event, we also had some visiting community partners who were able to set up tables in order to promote learning and to bridge what we did during this course to the broader Northfield community. It also gave people the resources to expand their knowledge and make learning fun.

In the Anderson atrium, the rest of the groups set up posters to share their findings, along with visiting community partners.
Discussion
It was great to see a wide variety of people, including Northfield community members, Carleton faculty and students, alumni, and more, interested in learning about the history of their community and archaeology as a field. It was also fun to see guests move from their preconceived notions of archaeology to a more nuanced understanding of the methodological tools that archaeology gives us to explore topics close to the community. “When I originally saw the poster, it didn’t seem like something I would care about, but after the groups started presenting on the complex history of the Olin Farm, I realized that the topics included exciting controversies and interesting storylines, which helped me acknowledge that the land we stand on has a rich, untold history” – Pranit Bhuvan (Community Archaeology Day guest).
Community members were also helpful in the sense that they offered different perspectives that we might not have thought about, therefore increasing our overall general knowledge and understanding of our topics. It was fulfilling to see that so many people were interested in learning more about archaeology, our methods, the history of the Olin Farm, and agricultural practices. We wanted to thank everyone who attended Community Archaeology Day for making this a special event. We often say as archaeologists that it’s not what you find, but what you find out.
Week 9 – Artifact Analysis
Created by Caroline Stanton, Brian Thevenot, and Santiago Enanoria
Introduction:
This lab was designed to help us understand and interpret the artifacts that were presented to us. In this lab, we utilized many different types of frameworks to ensure that we dated our artifacts properly and were able to identify what they were likely used for. Furthermore, our artifact analysis consisted of carefully weighing artifacts, hoping to see if there are any trends within the number of artifacts weighted. These practices and tests were based upon standards set by the United States government, which contains resources for archaeologists to identify when the artifacts were created.
Materials, Methods, and Challenges
One of the most important methods was keeping track of the artifacts that we’d found. To do this, we had multiple CSV sheets that helped to classify each specific artifact into materials that it was made of. This material included Metal (ME), Glass (GL), Faunal (FA), and Ceramics (CE). Each material had its own sheet with information regarding the weight, where the artifact was found, and a brief description describing each tiny artifact.
In this lab, the most abundant type of artifact type was metal and glass. Glass had over 260 observations, while metal had around 250 observations. The volume of type of artifacts, specifically building materials, highlights that the site where the farm once stood used to be a dumping ground for building materials. We know this because the abundance of nails found on the site were vast. Furthermore, the amount of nails appeared to date back to even the 1820s, an inference we can make based on the construction of each particular nail. Using the standards that were present by the US Government, we were able to identify and make a guess of when these nails were created.
One thing that was slightly more challenging, however, was trying to identify the use for certain objects. Within our metal bag, we found a set of keys that came in different sizes and shapes. One of the hard parts was trying to identify what the keys might’ve been used for. Given how rusty each key was, it was difficult to interpret what the keys might’ve been used for, and what they might’ve opened. However, using the same standards as above, we were able to identify each key as a skeleton key that likely dated pre-1940s.

Using the same standards created by the United States government, we were also able to make a guess as to when the glass was created. A lot of the glass found appeared to come from old milk bottles/food storage containers. Furthermore, given the construction of the glass, i.e. the color and curvature, we were able to date some of the glass to the pre-1940s. To do this, we followed the same classification standards to get a good guess as to when the glass was created.


After discovering the time period of when the materials were made, our next step in observing was to think about how it ended up at our excavation site. For instance, students that observed glass had to ponder the different kinds as well as the decorations they held. A vast majority of the glass was window glass but within that were several tens of subtypes that had to be considered. No concrete answers have been developed but potentials include a mass dumping event of glass from a site with window variety, art projects, and glass dumping from academic buildings with decorative doors and windows.


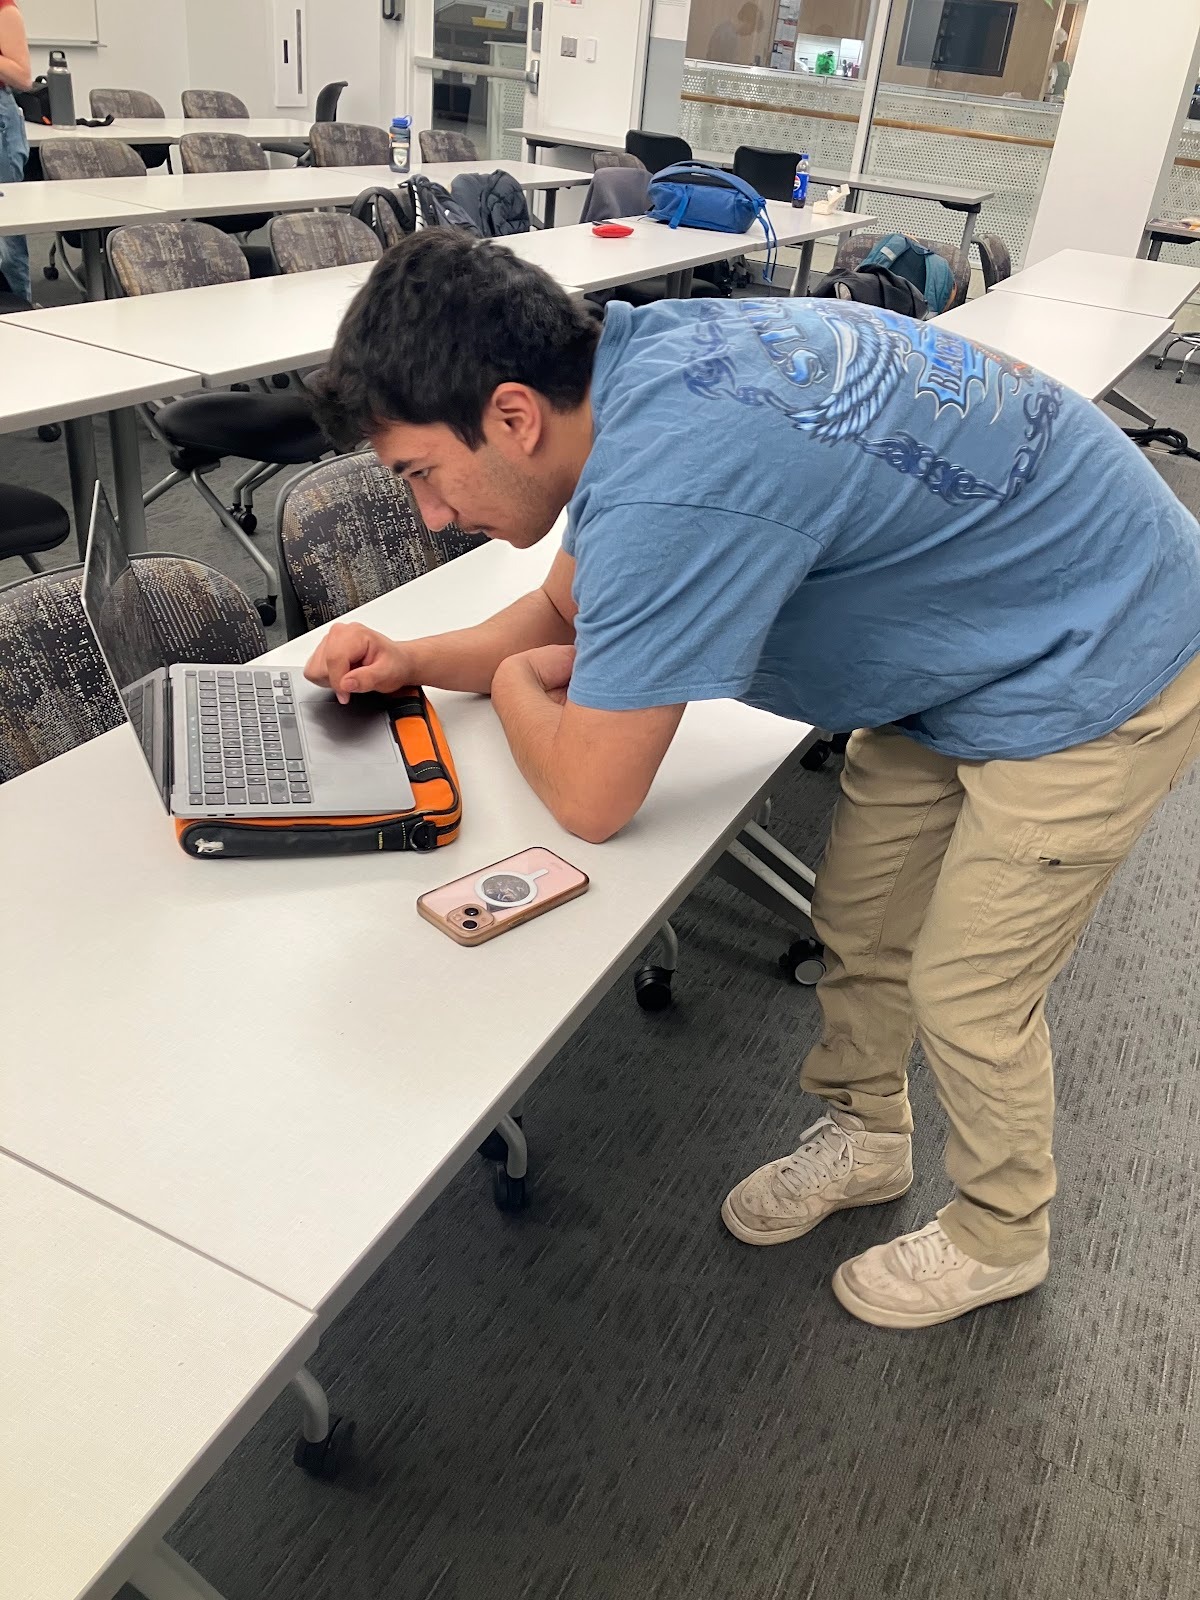
Additionally a few students began the process of 3D scanning artifacts. This is a way to preserve an understanding of the artifacts beyond photographs for students or archaeologists that cannot see the artifacts in person. It consists of using LIDAR scanning through an app on an iPad and then exporting the scan to an accessible medium (in our case, this website). The scanning is a way to make archaeology more accessible both in the field and outside of it, as access to artifacts is not limited to those that can see the artifacts in person. Given this benefit, it is a method extremely in line with the mission of community archaeology and our community archaeology day.


Conclusion
This week’s lab demonstrated how systematic classification and standardized dating frameworks allow archaeologists to move from raw material fragments to informed interpretations about past activity at a site. By organizing artifacts into material-specific CSV sheets and carefully recording attributes such as weight, form, and location, we were able to recognize patterns, particularly the overwhelming presence of metal and glass. These patterns, supported by dating standards provided by the U.S. government, allowed us to infer that the site functioned as a dumping ground for building materials during the nineteenth and early twentieth centuries. The prevalence of nails from the 1820s and the identification of pre-1940s skeleton keys and bottle glass further reinforces this time frame.
Although some artifacts, such as the assorted keys and decorative window glass, were more difficult to interpret, their analysis underscored an important part of archaeological practice: developing multiple working hypotheses when material evidence is ambiguous. The glass, for instance, may represent large-scale disposal events, artistic or institutional reuse, or simple household dumping, possibilities that require future investigation. Overall, the lab strengthened our understanding of how classification, careful observation, and comparative standards work together to transform scattered fragments into meaningful insights about a site’s history and use.
Week 8 – Curation
Created by Will Clausman, Feiran Wen, and James Coronado McDermott
Introduction:
Over the past few weeks, both lab groups have been digging test pits and excavation units around the Olin Farm (as discussed in labs 5-7) and finding artifacts for interpretation and analysis. While this process is a necessary part of archaeology, excavation is not the final step when it comes to the preservation and archiving of artifacts. Furthermore, narratives drawn about the Olin farm’s role in the history of Carleton, Northfield, and the broader Minnesotan agricultural community cannot be done solely based on the presence of a single artifact, rather in order to make concrete conclusions about the past, broader patterns about the artifacts that we have uncovered should be drawn. In order to assist with helping us to find those patterns, every artifact that we find must be cleaned, processed, and stored in a process called curation.
Methods and Challenges:
Different archeological expeditions, field schools, and firms all have different methods of curation, though most of them follow a few fairly important steps. The first step is to clean and prepare the artifacts and make sure that they are ready for preservation. The second step is to catalogue and decide where (if at all) to store the artifacts that you have just cleaned, while recording various qualities of the artifacts that you will add to your collection.
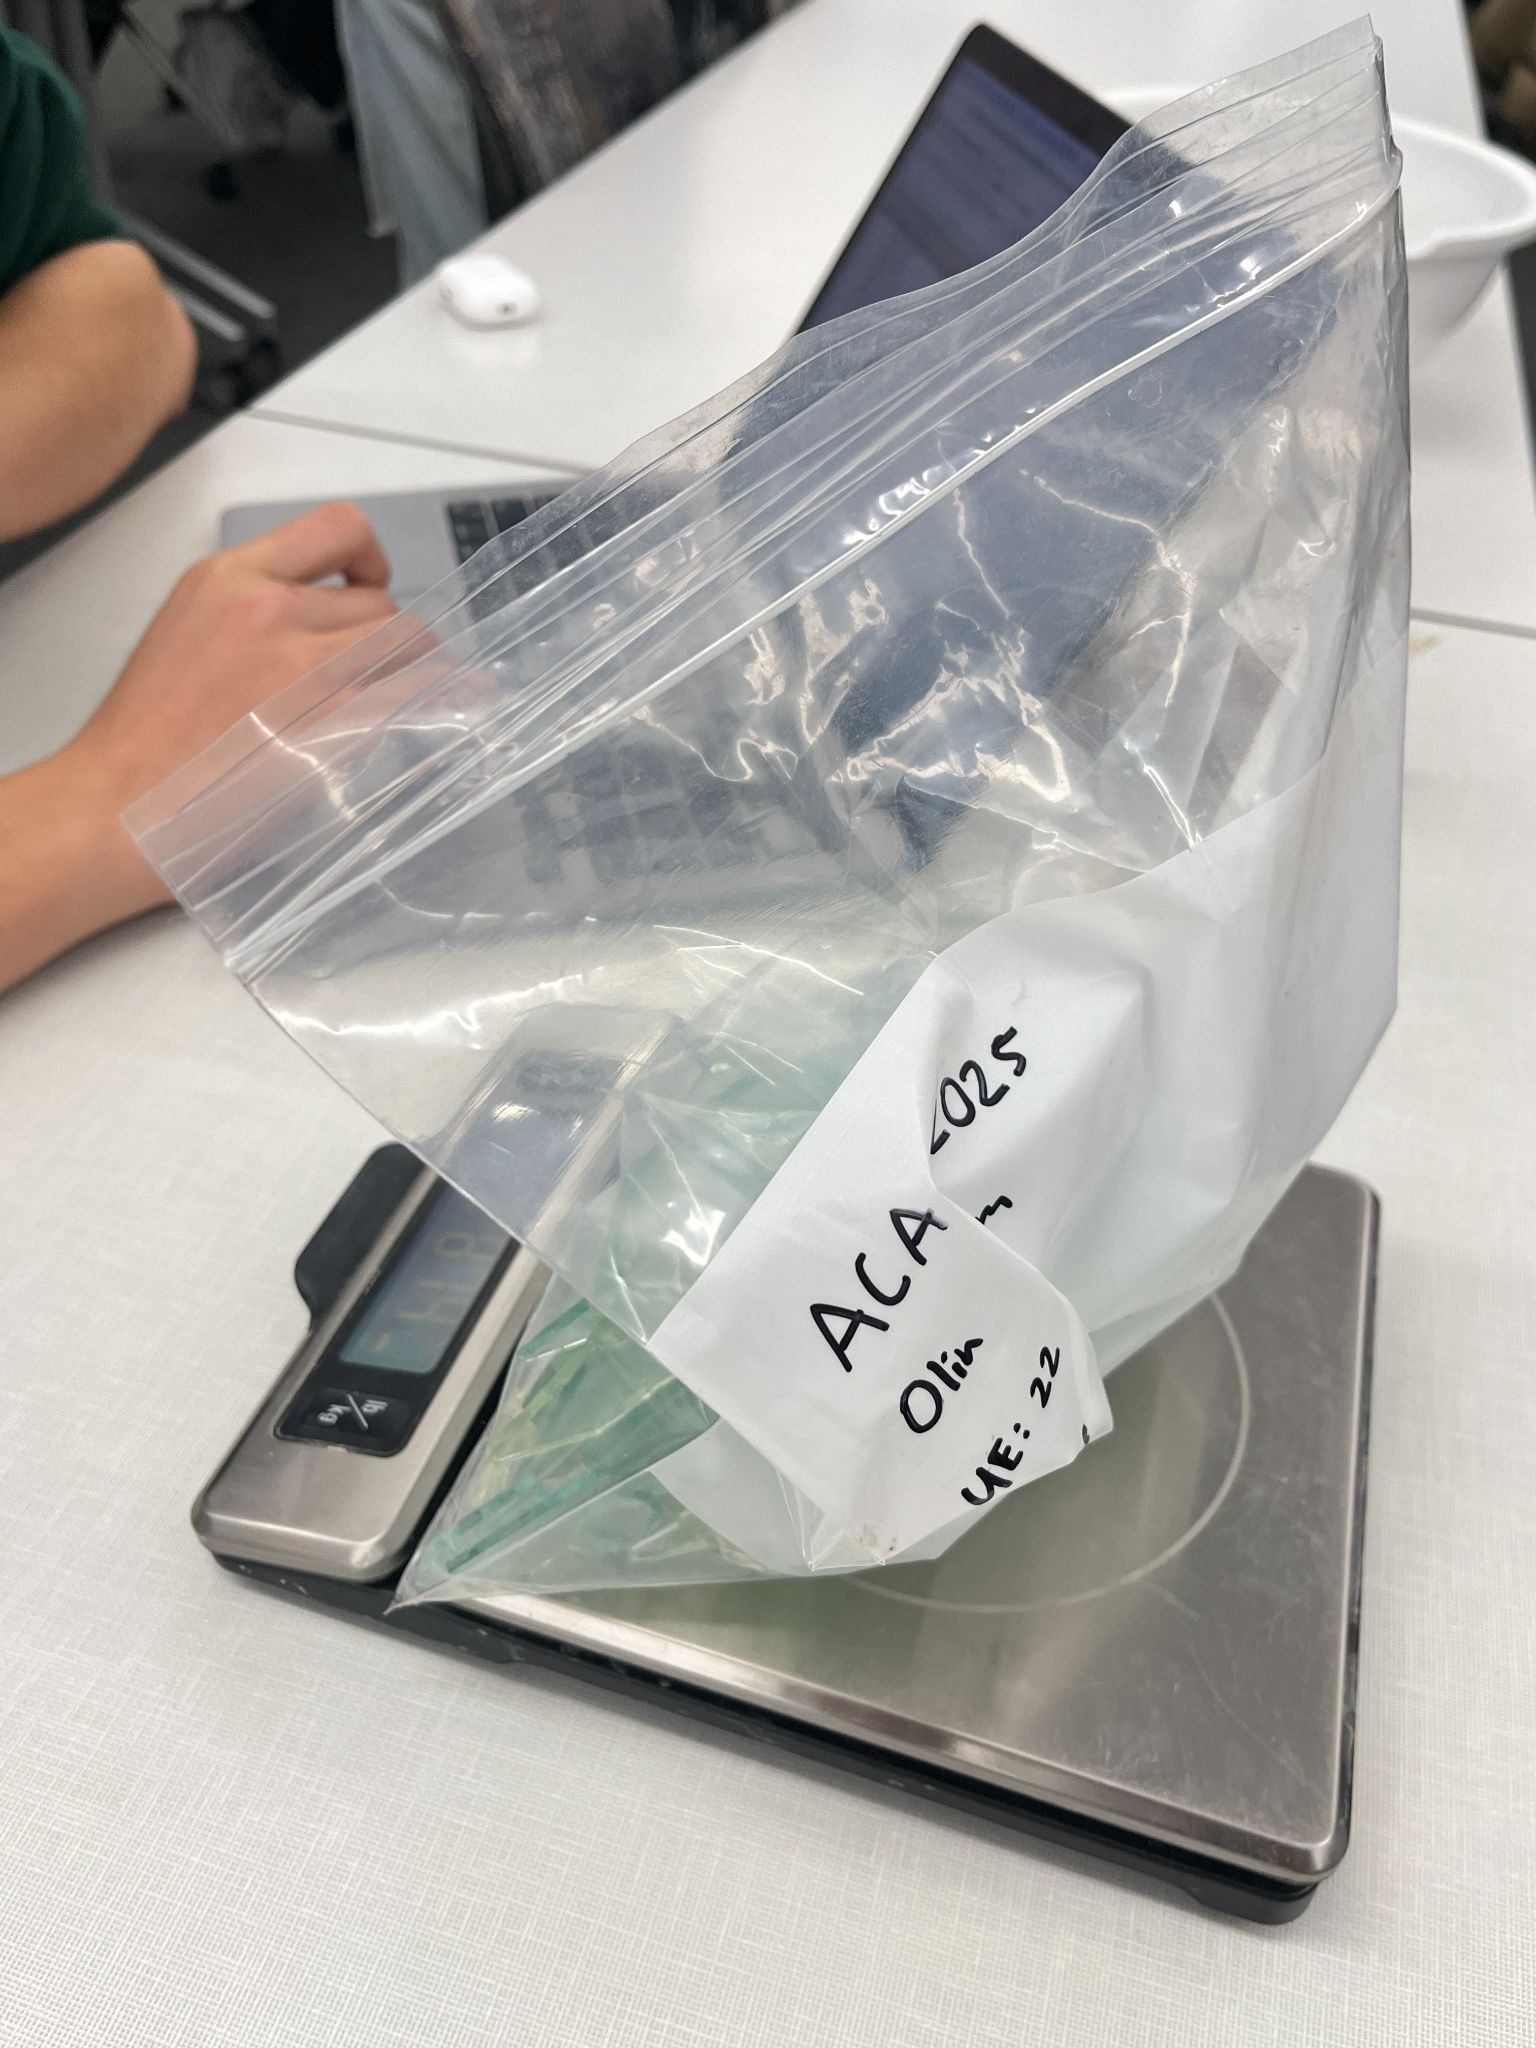
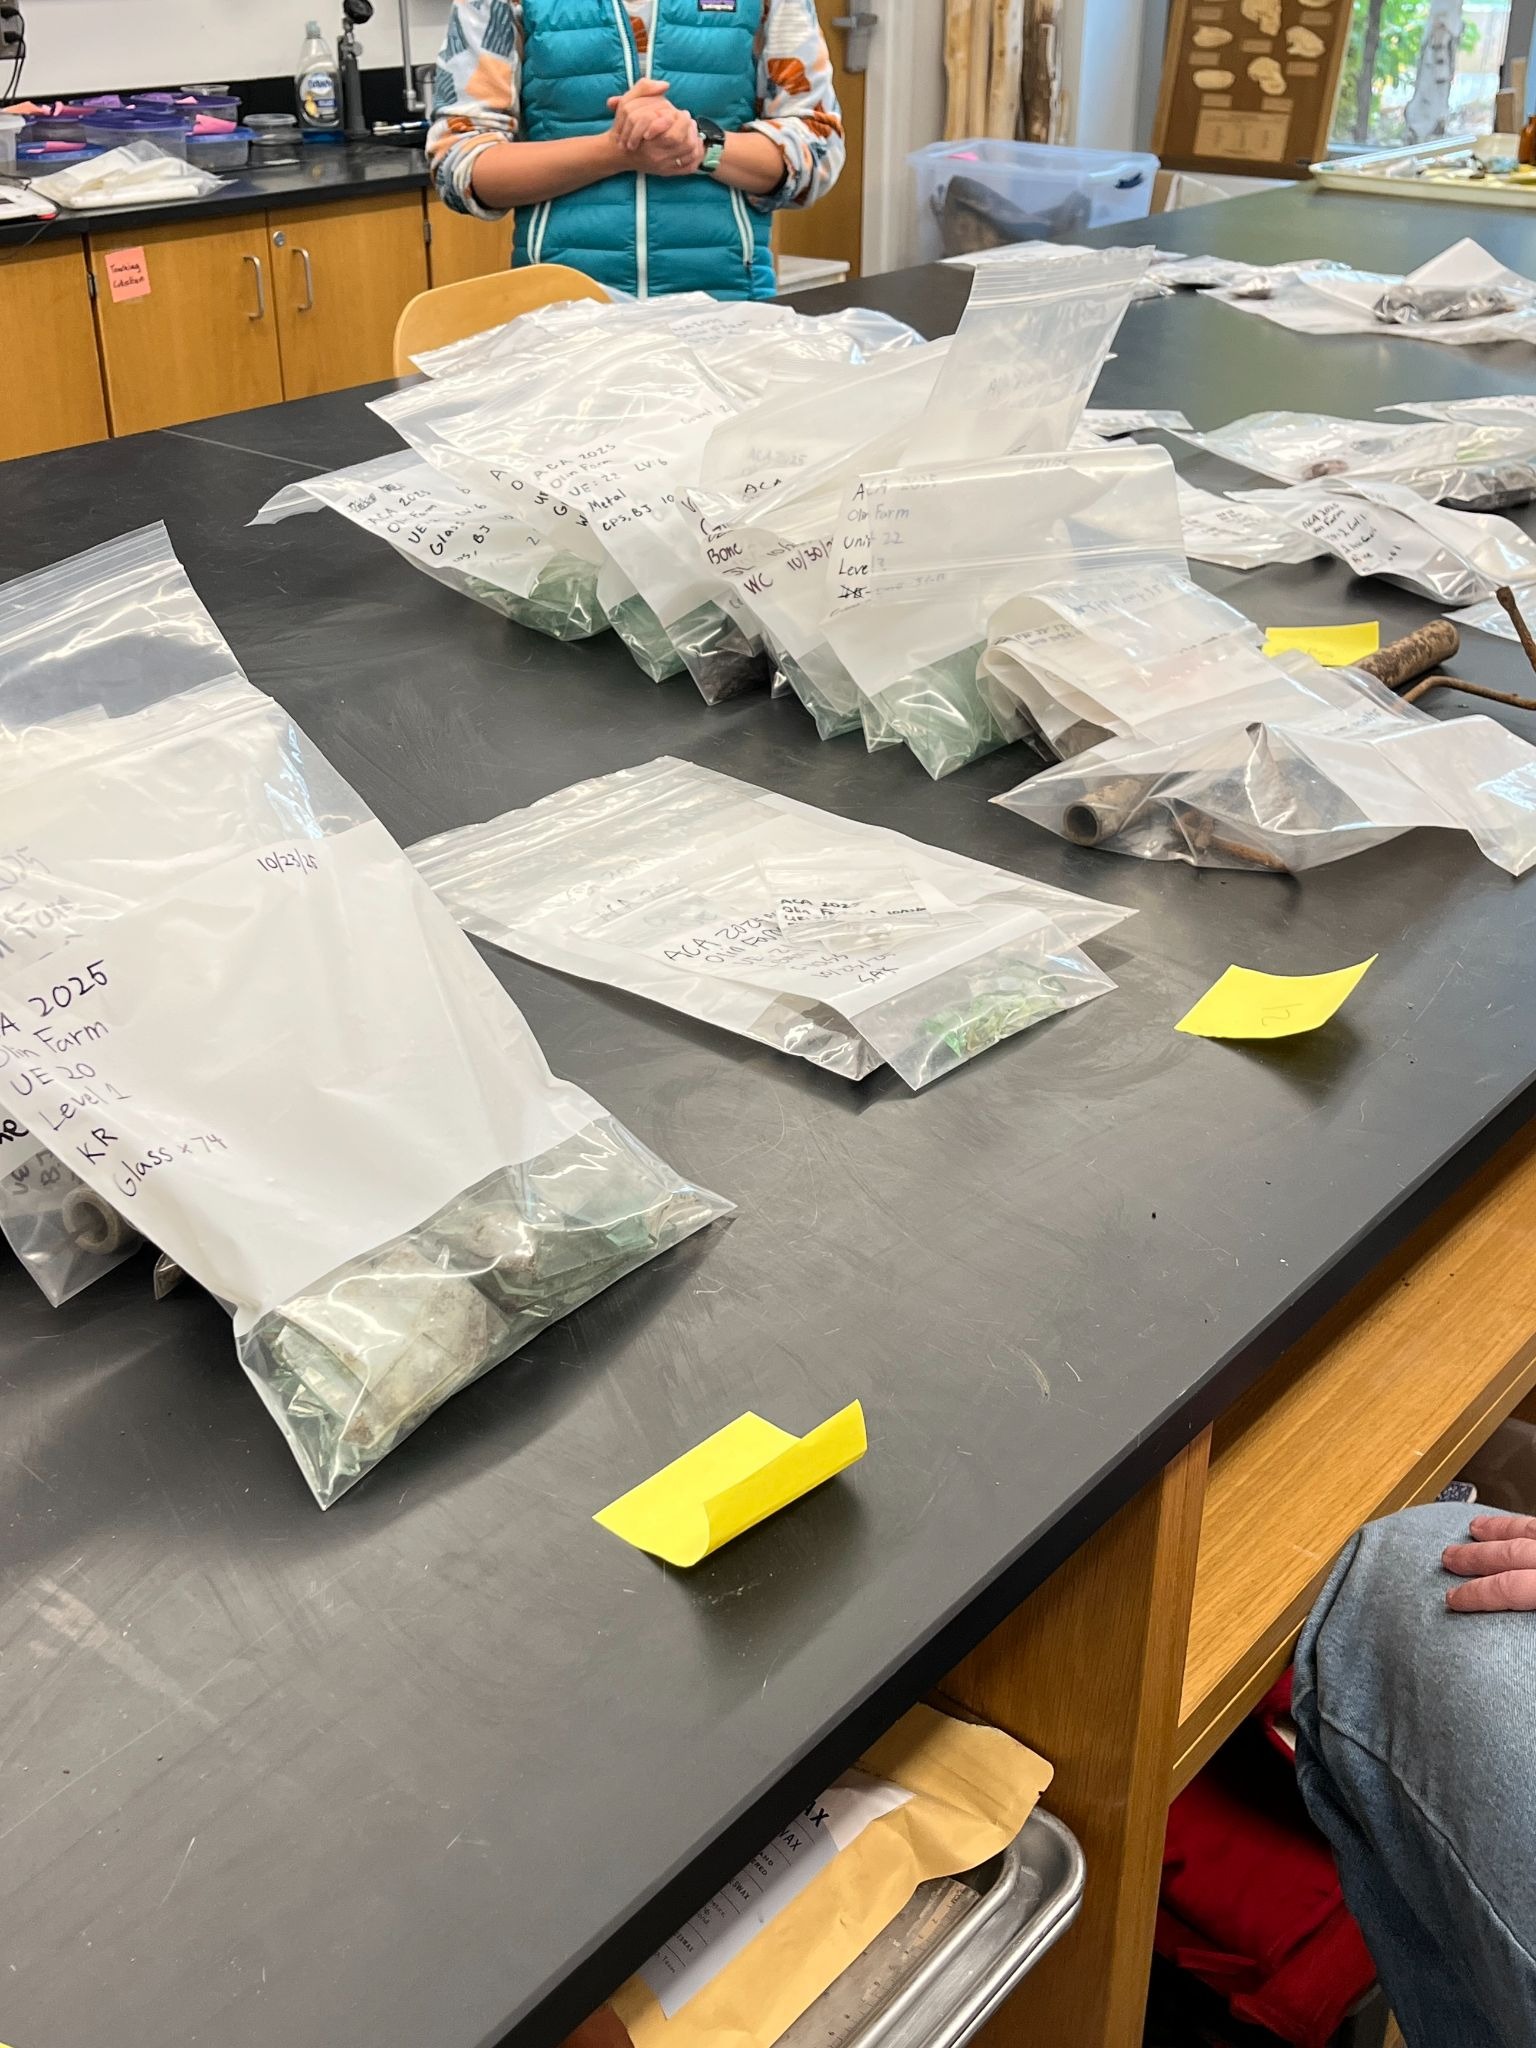
In our case, while in the arb, we labelled each bag with the name of our class (ACA 2025), the location (Olin Farm), the material, the initials of the person who verified the bag and the date of excavation. For the bags that contained artifacts found in shovel test pits, the shovel test pit number (e.g “STP 15” or “STU 4”) was included, while bags that contained artifacts that were found in in excavation units contained the unit number and the layer (e.g “unit 22 layer 4” or “unit 20 layer 1”) so that we can compare artifacts across layers over time. If the bag did not record any of this information, we could not process the artifacts inside (see figure 1 for a picture of one of these bags.) However, this information allows us to use relative dating and context to better understand the placement and relationship of our artifacts to the Olin farm.
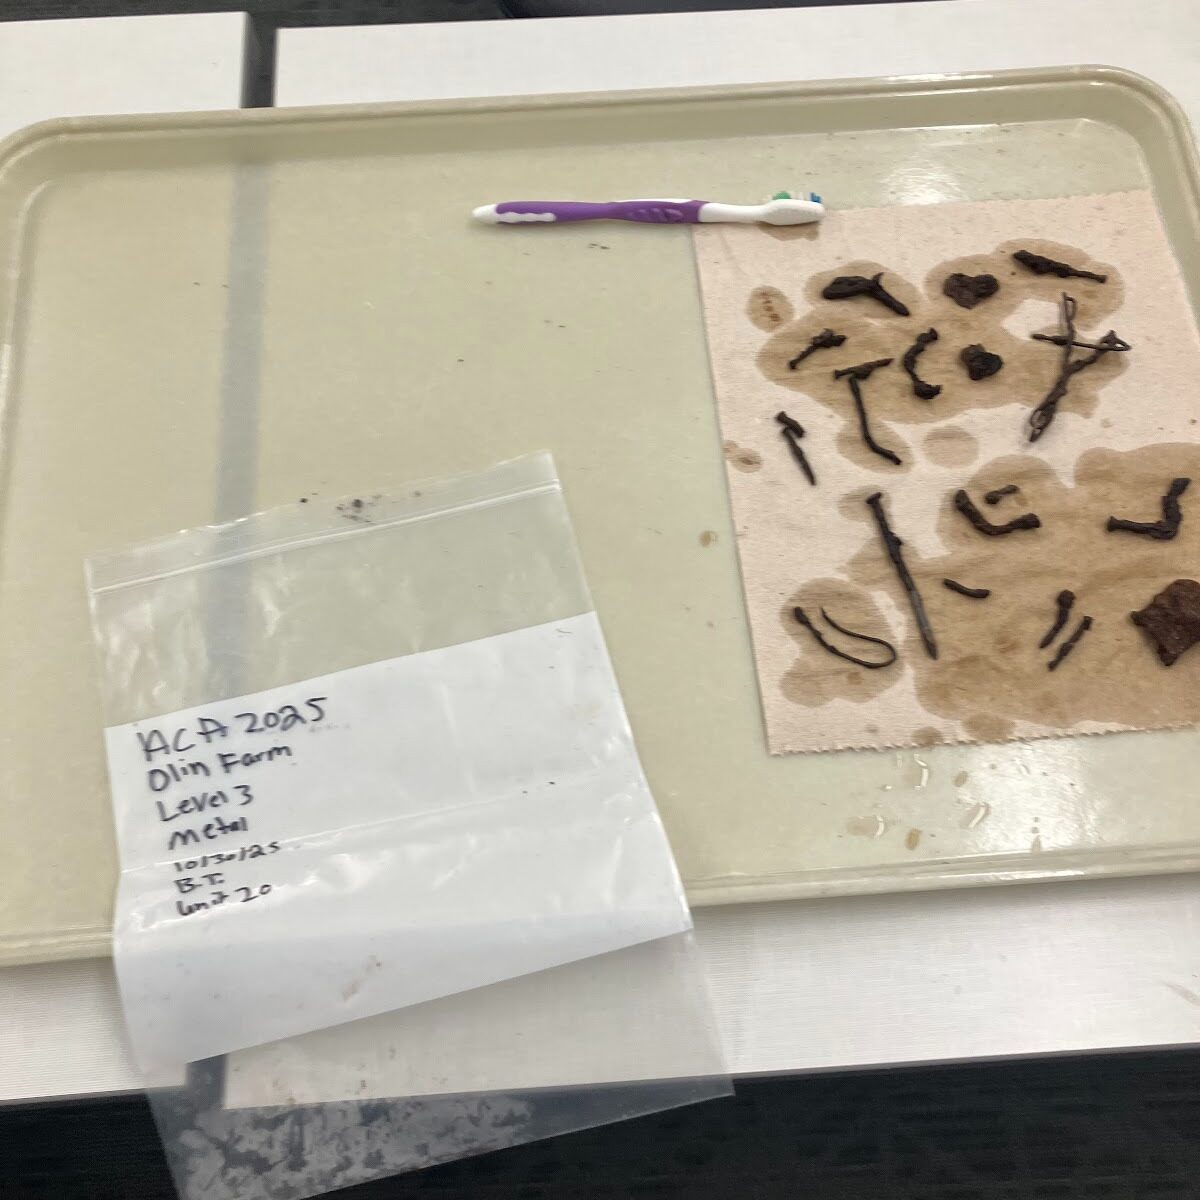
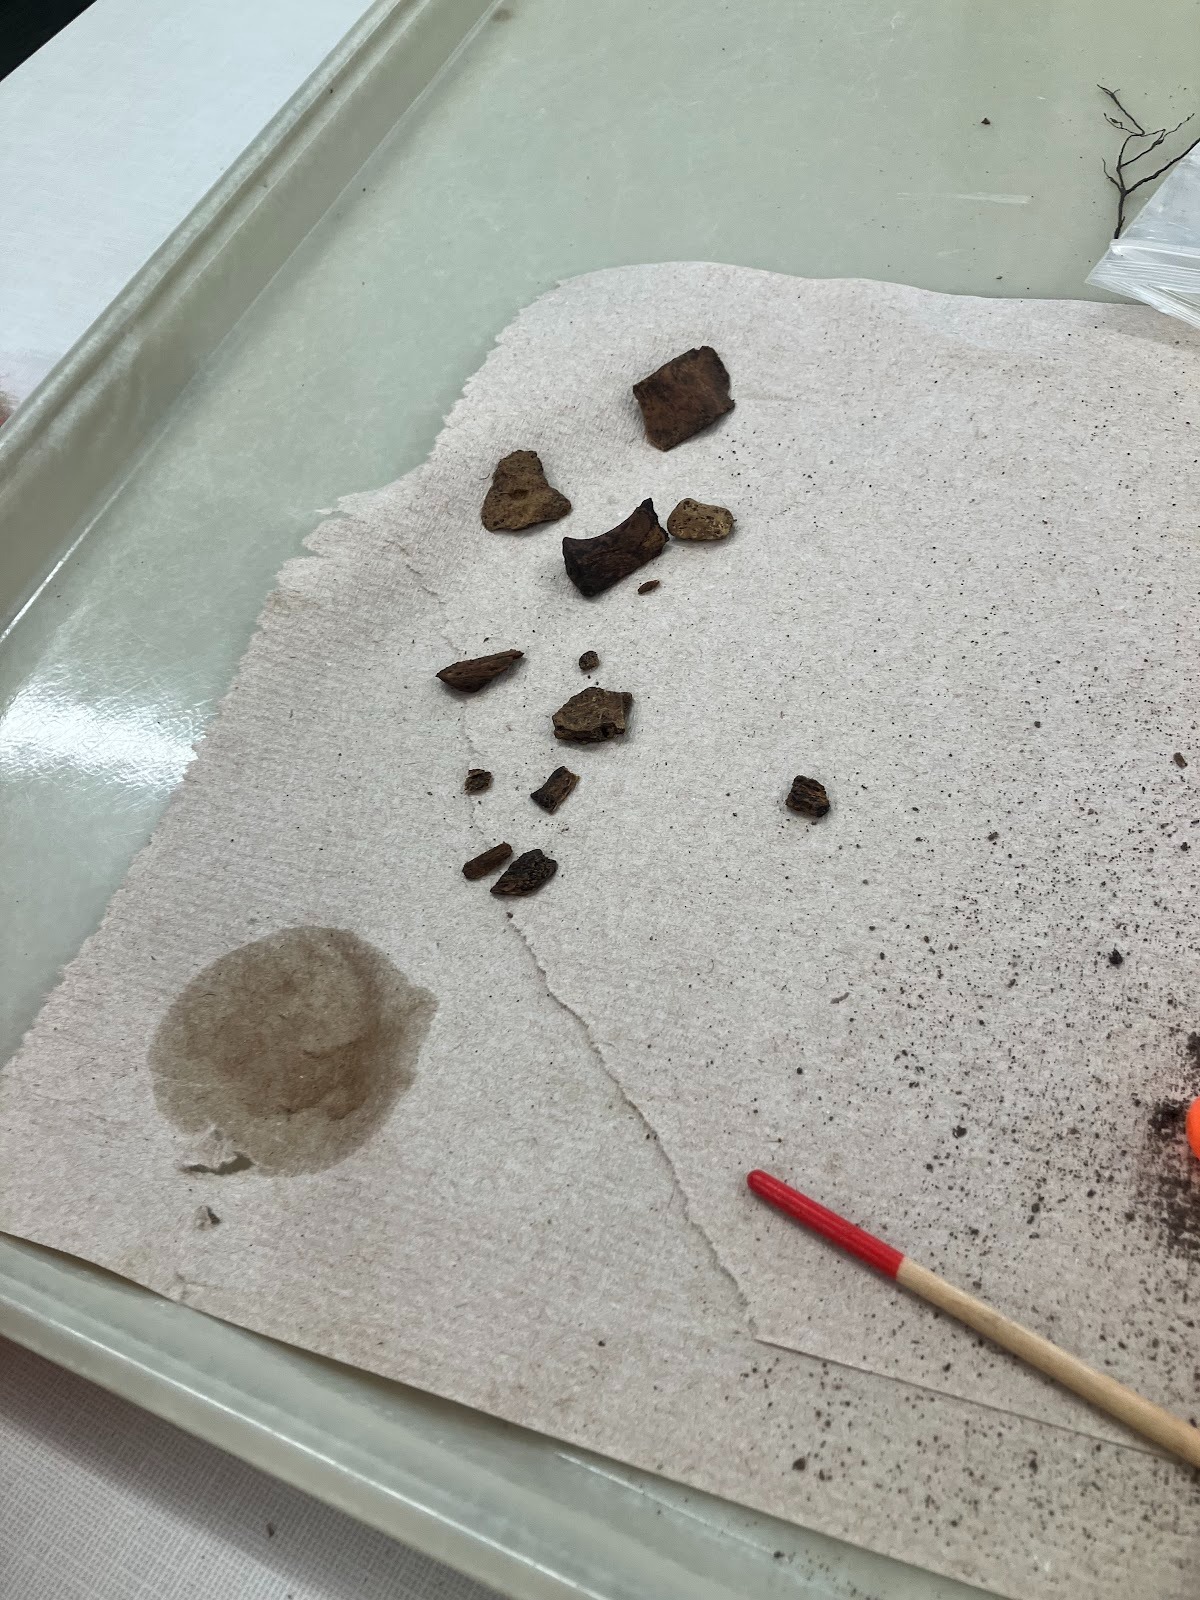
The first thing that we would do with a bag was to clean the contents of the bag. Many of the artifacts found in the arb still had considerable amounts of dirt on them, and thus needed to be cleaned. Furthermore, cleaning these artifacts, even with water and simple hand tools, could illuminate more about the specifics of each artifact and their relationship to each other, particularly in the case of glass.
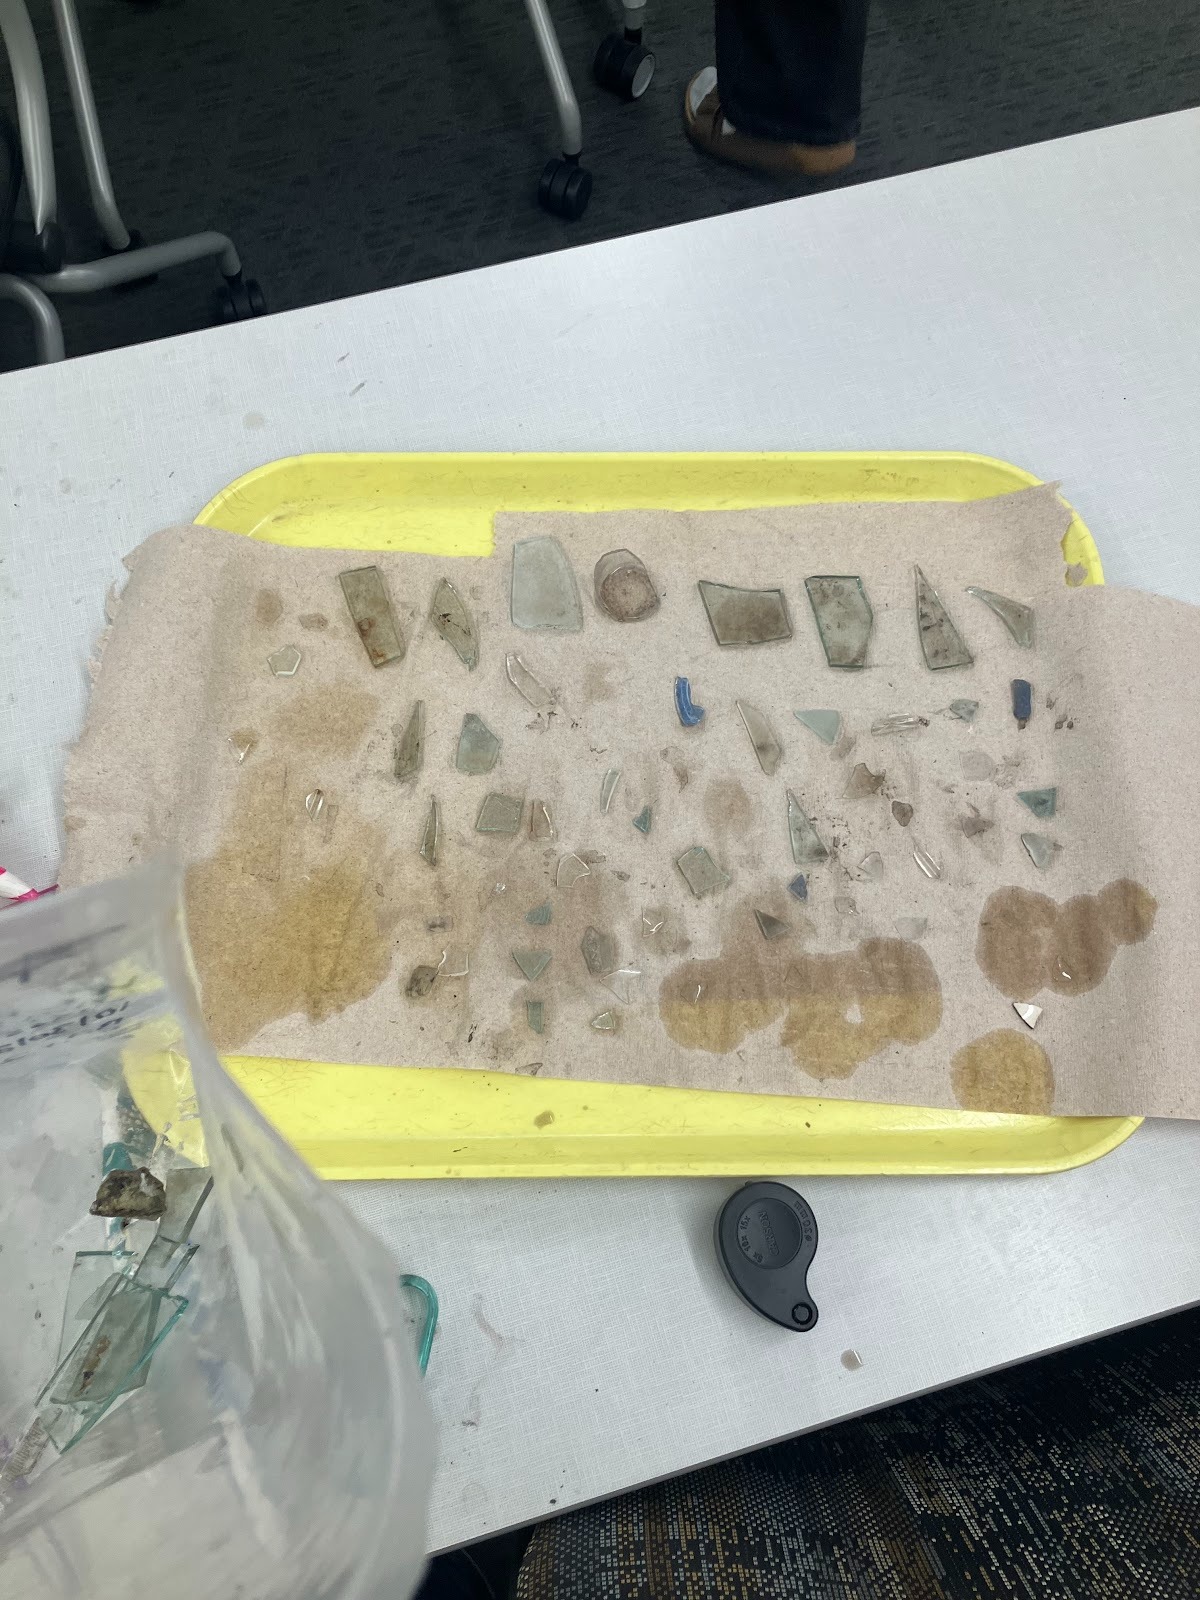
One bag that had various bits of glass (all found in the same layer at the same excavation unit) that were strikingly different colors from each other, different thicknesses and even contained different printing. These differences can tell us that rather than being part of the same larger pane, these pieces of glass likely came from different artifacts at some point in their object-lives. Furthermore, some artifacts had imperfections that could not be cleaned off (such as charring) that nevertheless can tell us about the disposal of trash in the arb in Carleton’s recent history.
After the artifacts were cleaned, they were weighed (in grams) and counted. Since each bag contained all of the artifacts made from like material (e.g metal, glass, paper, ceramic, or bone), we counted the number of each artifact found in each bag to the best of our ability. Some bags (particularly bags with glass) had upwards of 200 pieces, though on average each bag had about 20 artifacts. All of this data, in addition to the data found on each sheet (e.g. the counts of slags, bricks and other building materials) was entered into a spreadsheet to unite the finds and store these data in a single central place.

During this process, we also cross-referenced the existing entries in the online database with the original field sheets to verify and correct any inconsistencies in the recorded data. After the artifacts were cleaned, counted, weighed and put into their bag again (or a new bag), they were stored in the archaeology lab behind the classroom, where they were sorted based on where they were found (both based on test pit and excavation unit.) While there were some difficulties in recording this much data from so many different archaeologists, and a few bags were mislabeled, the dataset is mostly ready for some artifact analysis, which we will begin next lab.
Conclusion:
Most of the time, archaeology is not merely the study of one artifact or one find in order to ascertain broader understandings of human activity in the past. Rather, it often relies on the systematic observation and analysis of many artifacts in relation to one another and the broader context. Thus, in order to fully understand the past, not only is data gathered, but it is also processed and recorded to create a larger dataset to analyze. While this lab may not have been as physically demanding or as closely in line to popular conceptions of archaeology, this lab was a tedious though necessary step in order to better understand human activity at the Olin Farm.
(Images courtesy of Will Clausman, Feiran Wen)
Week 7 – Excavation Day 3 (final excavation)
Created by: Eve Hatcher Peters and Jolin Liu
Introduction:
This week in Archaeology Lab, we continued learning how to excavate, and for many groups this meant learning how to continue an excavation unit which had been started by someone else.
For the Tuesday group, this was many people’s first day of excavation. They started in the classroom while Sarah instructed them on the basics of excavation, including how to take a level and measure the depth of your unit, how far to dig before taking another level, how to label artifact bags, and how to record data in excavation forms.

Fig1. Site Map with unit numbers
Upon reaching the site, students divided into their groups and began setting up their areas. Tuesday’s group most likely had a slower start than Thursday’s, but both lab sections had to navigate excavating a unit which is also being excavated by someone else. With more familiarity and experience, each group became more efficient and made a lot of progress. While the levels of the units got deeper and deeper, more evidence of the barn began to appear from the soil.

Fig 2. Tuesday’s Lab section preparing to excavate on units #21 and #20 (Photo courtesy of Eve Hatcher Peters)
Method and Challenges:
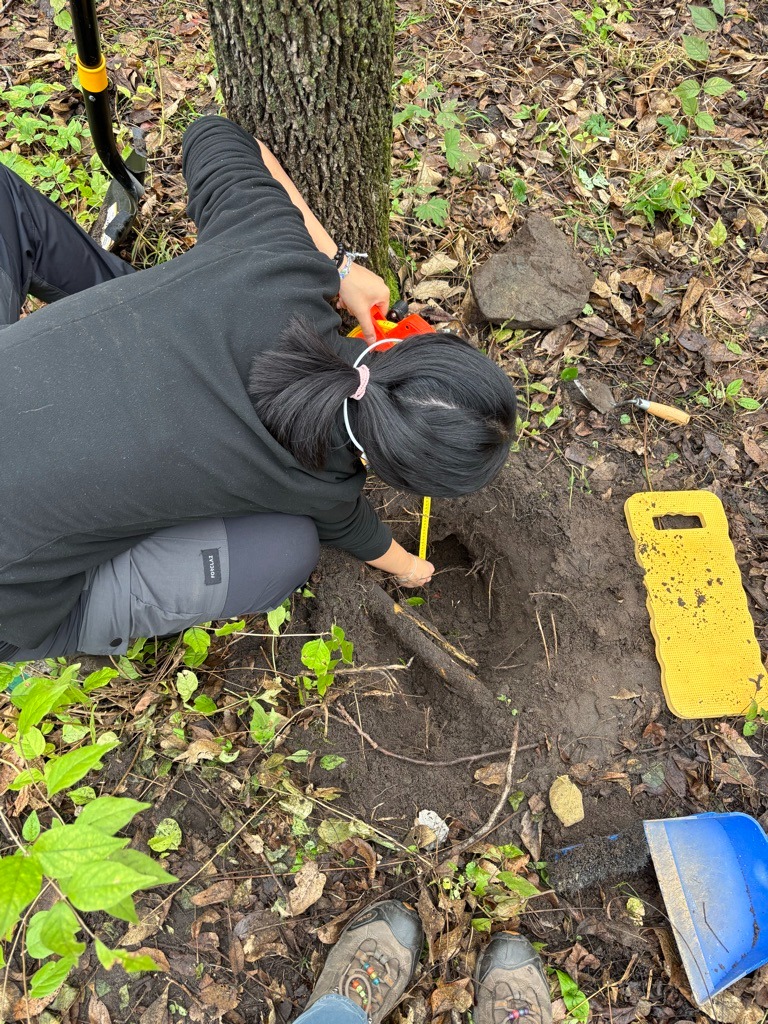
After collecting all the necessary materials: gloves, dustpans, trowels, clippers, measuring stick, buckets, a clipboard, and a bubble level device, students were almost ready to begin. Sharing a site with a group that works on a different day meant that before we began we had to take levels of the unit. For example, in unit #22, the previous lab group had started on layer 3 but not completely finished, so taking a level allowed students to determine how much further to dig before starting a new layer of excavation. Next to the unit was a metal stake with a string attached, which is called a datum point. The datum point represents ground level or 0, so every level taken below that is measured in centimeters below the ground level. In order to measure the vertical distance from the ground level (datum point), measurements are taken from the bottom of the excavation unit to the string. The string has a bubble leveling device in order to ensure accuracy, and measurements of the unit were taken in each of the corners and in the center. By comparing these measurements to the previous group’s initial measurements when they began excavating layer 3, we were able to determine how far they had dug in this layer and how much further we should continue.

Fig 3. A datum point and string used to measure a level in unit #20 (Photo courtesy of Sela Nesin)
One indicator that your excavation has reached a new vertical layer is a change in the composition of the soil. In unit #22, there was slightly sandy and grainy soil to begin with, but as the excavation went deeper below ground, the group working on it began to notice the soil became more densely packed and had a more earthy clay-like texture. The group working on unit #20 also noticed a change in soil composition in their excavation, as the soil got much more rocky in lower levels. However, identifying these shifts in soil composition and color was sometimes challenging for us, as they are often very slight shifts and are much easier to identify with the trained eye.

Fig 4. A large piece of the barn foundation in unit #20 (Photo courtesy of Caroline Stanton)
Excavation was done with a trowel and a dustpan, and we had to try to make sure that our digging and removal of soil was even across the entire 1 x 1 meter unit. We also had to make sure that we were paying sufficient attention to the excavation of the corners and ‘walls’ of the unit, so that the sides were flush and even with each other. What worked the best for our group was to remove or displace soil with a trowel, then to use the trowel in one hand and a dustpan in the other to collect the loose soil and place it into a bucket to be sifted. Any artifacts that we found also went into the bucket with the soil – provided that they weren’t particularly delicate.

Fig. 5. James, Jolin, and Christian excavating using a trowel and dustpan (Photo courtesy of Eve Hatcher Peters)
Another challenge that we faced this week in excavating was keeping our excavation units level as we worked on different layers. Several groups had problems working around large root systems that were growing out of their area, and one group was excavating on an incline. The groups that excavated unit #22 had to take turns digging because the steep slope of the hill on which the unit is only makes it possible for three people to work on it at any given point in time. Additionally, the back corners of the excavation unit were much harder to reach, and it was more difficult to keep the back walls leveled. This challenge is something that professional archaeologists often encounter, as excavation sites come in all geographical areas and archaeologists often have to work around mountains and hills.
After filling several buckets with dirt, groups would take their collected materials to the sifter. This step was a little more familiar to many of us, as it was a part of the process of test pitting as well. Sifting the soil helps us separate soil and very small natural material from larger material. With almost every sift, you get some artifacts – maybe some glass, rusty nails, shards of brick or building materials, ceramic shards (if you’re lucky), and sometimes lots of slag! However you would almost always also get very small sticks, rocks of varying sizes, and pieces of building material, brick, or slag that were too small to count.
Result:
In Tuesday’s lab, more nails, glasses, bricks, and slag were being found. These indicators further suggested that there was a construction waste dump on the site we are digging. Many of the glasses found at unit #20 were burned, indicating that Carleton was burning their trash at the site, which we don’t continue doing due to its harmful effect on the environment. But the behavior of burning trash might be a lead for us to date the trash dump.
There were four more skeleton keys found at unit #20. In total, there were nine keys found in the same units. Although we still don’t know what the keys were for and why they were dumped, it might show that besides industrial waste, there was also personal trash thrown out at the site.

Fig. 6. Skeleton keys found in unit #21 (Photo courtesy of Jolin Liu)
For Thursday’s lab, one porcelain was found in unit #22, on the bottom of level six. It was a very exciting finding, not only because it’s something besides glasses, nails, and building materials, but also because it’s in one piece, a complete white porcelain saucer. Even though it’s covered by dirt, we can still see its pure white color and a shining golden line on the edge of the plate. This artifact makes us wonder what is considered trash. Since it’s in good shape and good color, there’s no significant reason for it to be thrown. Moreover, it also suggested that the trash dump is not solely composed of construction trash but also personal waste or collective waste from the dining hall or other organizations. We also believe that the top layer of the soil deposition is mostly trash, and we haven’t reached the period of the stratigraphy that was “lived in” during the ‘20s or ‘30s.

Fig 7. Ceramic saucer found in unit #22 (Photo courtesy of Zoe Pinto)
Week 6 – Excavation Day 2
Created by: Ben Jerris and Gunnar Gregory
Introduction:
Our lab this week showed us how early parts of the excavation process can help guide us on later excavations. Specifically, by washing our artifacts from the test pits, and also by digging even more test pits, we were able to start larger excavation pits. We were also able to learn how integral specificity and accuracy are to the processes of archaeology.
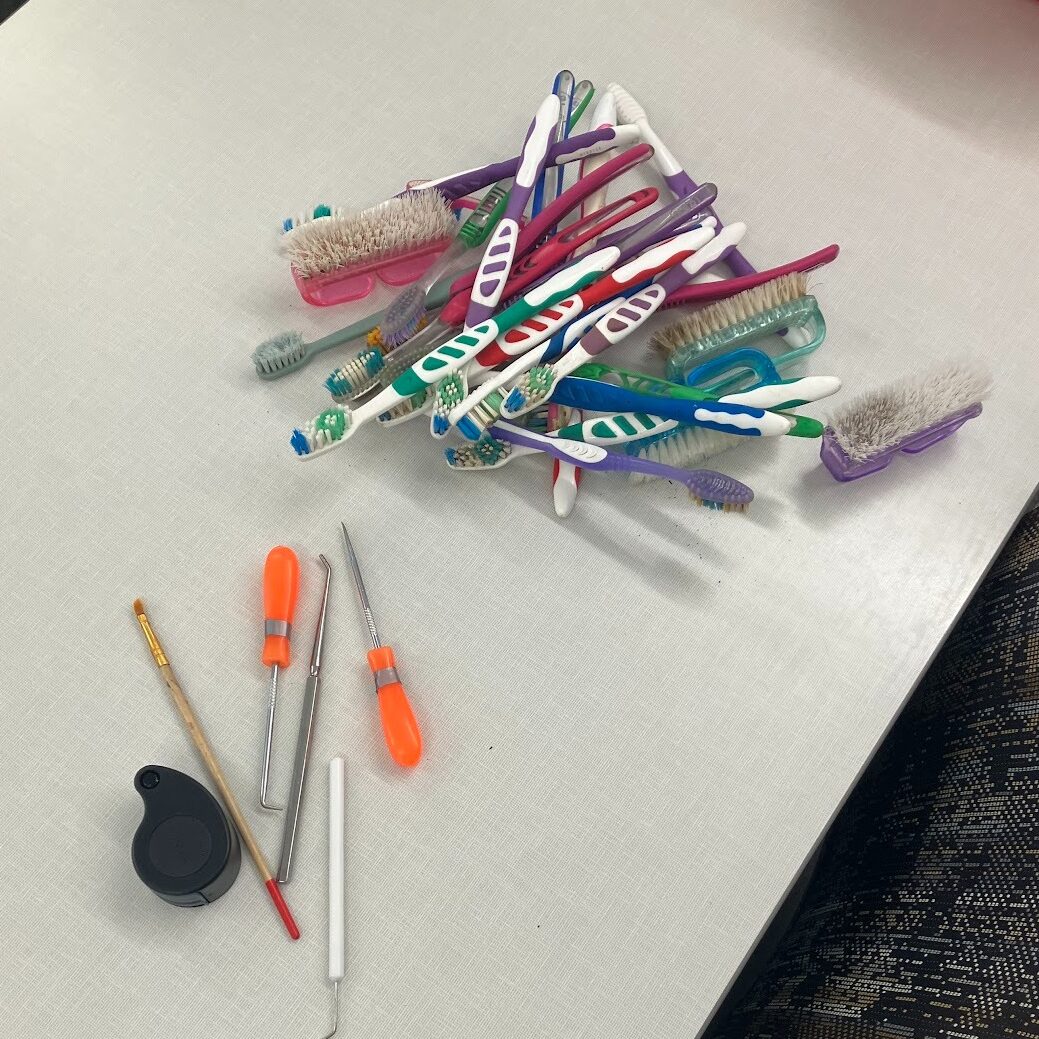
The Tuesday lab, faced once again with uncertain weather, began by washing the artifacts that were collected in the test pits last Thursday. This was done using tools such as toothbrushes to fully scrape off dirt. Interestingly, this process of washing off artifacts revealed that some things weren’t quite as important as we initially thought, but we’ll discuss that more in the results section. With more insight as to what kinds of artifacts are significant, the Tuesday lab group was able to resume digging test holes similar to the ones that were started last week. Once again, test holes were 50 cm in diameter and dug down to about 50 cm deep. Soil color and texture were both recorded, and all soil dug out of the holes was sifted to ensure that no archaeological material was thrown out.

Figure 1: Violet and Marina using toothbrushes to clean artifacts.(Photo courtesy of Sela Nesin)
The Thursday lab group was split into several groups. One group of three students continued to work on the final shovel test pits. They were assigned this task because they are normally in the Tuesday lab, so they hadn’t performed a shovel test pit yet. The remaining groups, each with about four students, began prepping and working on larger excavation pits.

Figure 2: Thursday’s lab section standing on the excavation site surrounded by already completed test pits.(Photo courtesy of Gunnar Gregory)
The three test pits dug during Thursday’s lab were found to have large pieces of foundation, possibly indicating the location of the building. The excavation pits were placed in two general locations. Pits 20 and 21 were located along the east side of the barn close to a location where the shovel test pits had located possible foundation material. Pits 22 and 23 were located to the south of the barn where there had been an old trash dump.
Once the locations for the pits were identified, groups used stakes and string to mark out 1×1 meter squares. This process was notably more difficult for pits 22 and 23 due to their being located on a hill. From here, we were able to dig for artifacts, being careful to keep the base of the pit level. Similar to the shovel test pits, all soil dug out of the pit was analyzed for color and texture, and all soil was sifted to reveal any artifacts. At the top and bottom of each layer, we recorded how far down each corner of the square was, as this allowed us to have a better understanding of how level the squares were.

Figure 3: an excavation pit after being set up, but before excavation begins(Photo courtesy of Ben Jerris)

Figure 4: an excavation pit after excavation had halted on Thursday.(Photo courtesy of Ben Jerris)
Results:
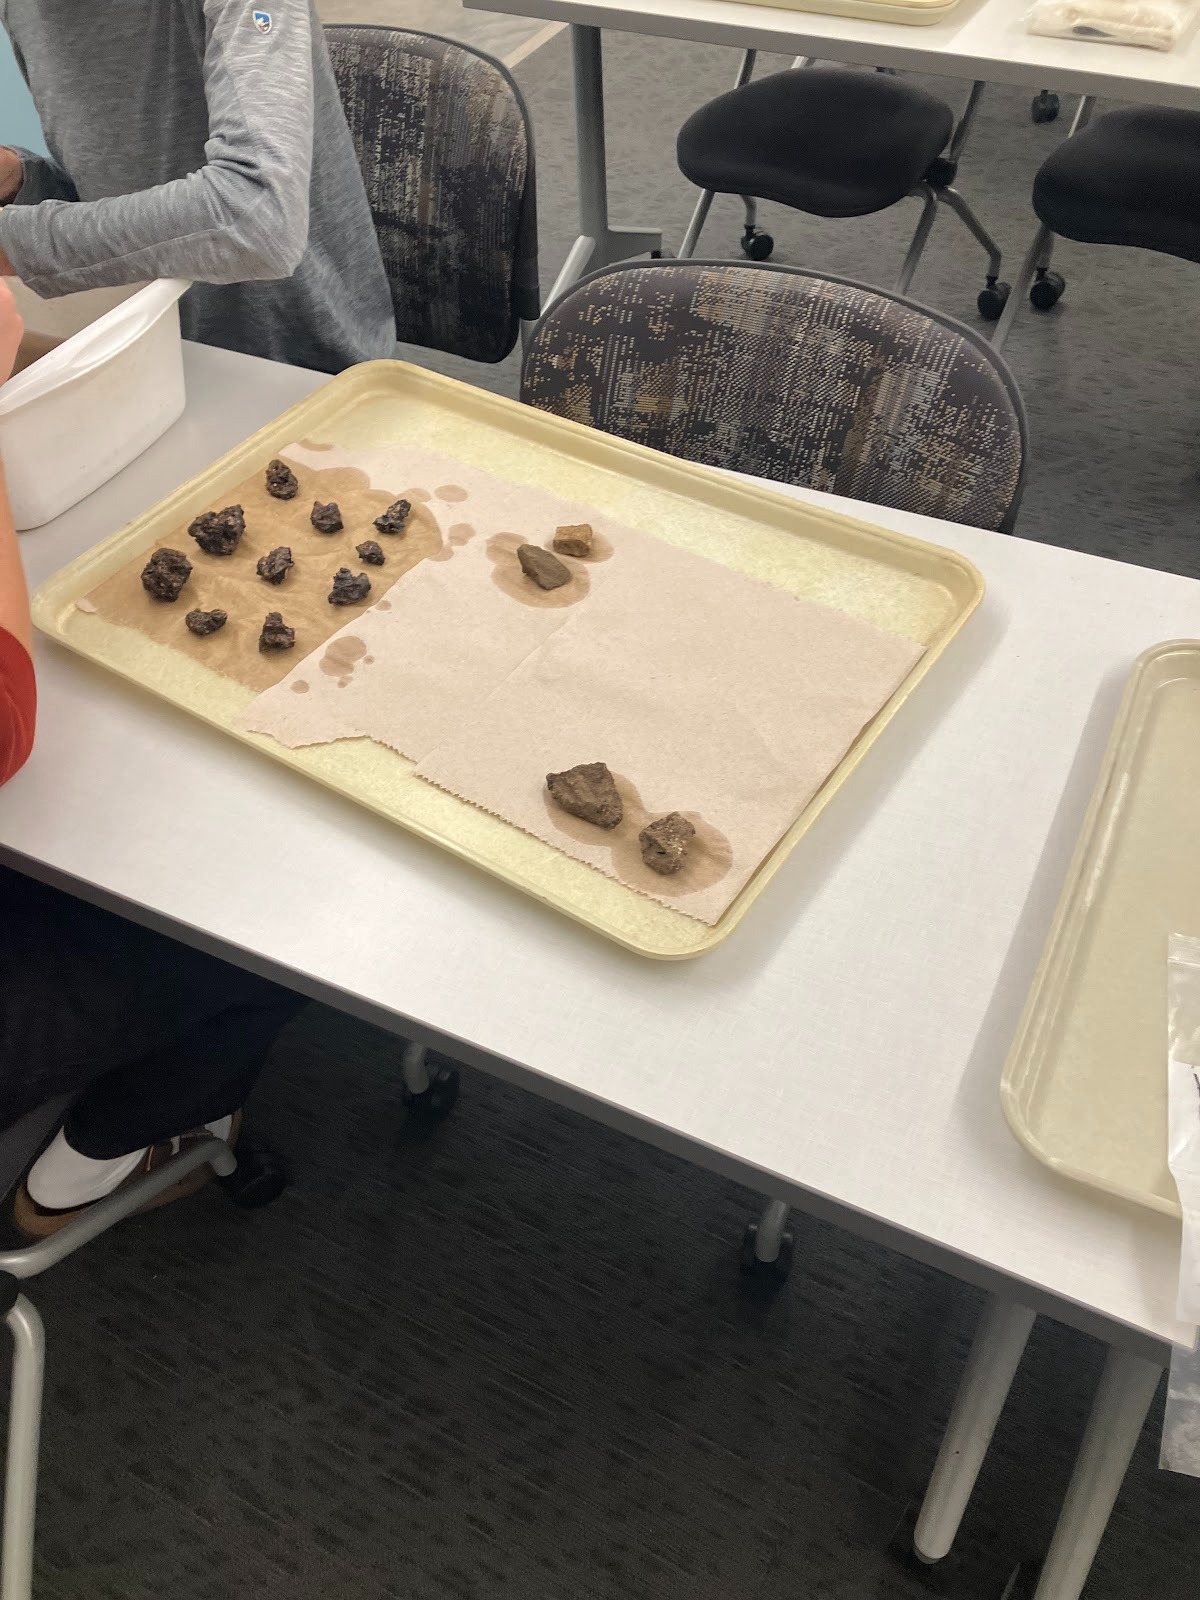
Washing the artifacts on Tuesday helped us to identify places where we were picking up finds that weren’t actually archaeologically significant. These finds included walnut shells and rocks that didn’t originate as building material. Based on this, we have a better understanding of what these kinds of objects look like, so we can make a better effort to avoid collecting them as we continue our excavation

Figure 5: Multiple artifacts from last Thursday’ s lab in the process of being cleaned.(Photo courtesy of Sela Nesin)
The test pits dug on Tuesday revealed similar finds to last Thursday, including bricks, concrete pieces, and some pieces of glass. One especially promising find was a large continuous layer of concrete that was found at test pit 14, which we believe could be part of the foundation of the barn. We placed some test pits near this location on Thursday so that we could attempt to unearth more of the foundation.
On Thursday, we didn’t have enough time to dig deep enough to reveal more of the foundation, but excavations were fruitful nonetheless. Finds included 5 keys (4 skeleton keys and one more modern key), a large number of nails, some wires, some more pieces of concrete, and some glass. Much of the glass was found in the Northeast corner of pit 20, and some of the glass had been melted at one point.

Figure 6: Keys found during Thursday’s lab.(Photo courtesy of Ben Jerris)
Our interpretation of these finds is that the keys were likely on some kind of key ring, which would explain why they were found close to each other. The large amount of nails and glass suggest that these artifacts were likely deposited as some kind of junk heap following the demolition of the barn. Some of the finds may have been from the barn, but most of them are likely unrelated. As we continue excavation in future weeks, we hope to uncover more of the foundation and potentially find artifacts that we can better link to the barn itself.
Week 5 – Excavation Day 1
Created by: Jennifer Bricker and Bruce Jones
Introduction
Most people assume archaeology consists solely of digging. While we have learned that excavation is just one of the many methods used by archaeologists, this week we did just that: dig! During this week’s lab, we chose where to dig, set up and mapped our grids, and dug test pits. Tuesday’s lab group was assigned the task of creating a grid-based sampling method of 3 x 3 meter boxes marked with blue flags, which also contained orange flags denoting surface artifacts. In all, they prepared 29 shovel test sites for digging. Thursday’s lab group divided themselves into groups and excavated 17 test pits. Each test pit was circular with a 50 cm diameter and dug to a depth of approximately 50–60 cm deep. Each group also recorded information on each of the test pits, including soil texture and color using the Munsell Soil Chart field book, the number of artifacts found, and the depth of the hole.

Methods and Challenges
While weather challenges affected both groups, Tuesday’s lab section was unable to dig due to heavy rain. They adapted to the weather conditions and helped Thursday’s lab section by laying out and mapping a grid system. Afterwards, they looked at artifacts found by previous groups of students at the Olin Farm Site. Among the most interesting artifacts were pieces of glass with the Carleton emblem, juvenile animal bones, and a metal bracelet.

Thursday’s group began their lab by first dividing themselves into smaller teams of 2–3 people. Each of these teams was then assigned a test pit and used large shovels, trowels, and even clippers to dig. Stones, plant matter, and tree roots often impeded the digging process, requiring teams to either work around the obstacle or—ideally—remove it. Dirt from each test pit was put into large plastic buckets to later be sifted through.
Once a test pit had been dug to the desired depth and width, teams carried their bucket(s) to the area set up for sifting. One team member held the screen while another emptied dirt from a bucket onto the wire mesh. Then, the team member in control of the screen would pull it back and forth in a rocking motion to allow for dirt to fall through the screen. In doing so, larger objects and artifacts remained on the screen for team members to look at.

While in the process of sifting, Thursday’s lab section ran into the issue of how to record the high number of brick fragments and pieces of slag. They ultimately decided on only counting pieces the size of a quarter and larger. The high number of artifacts found at shovel test sites #16, #17, and #18 reflects the many pieces of brick and slag found in this area.
Despite a brief burst of light rain, the weather cooperated with the Thursday lab’s efforts. The rain—with that being said—did have a potential effect on data collection. We tested the soil by comparing the dirt from each test pit to color chip samples in the Munsell color chart (see Figure 6). This let us determine the hue, value, and chroma of each sample. When testing for soil composition and color, the rain could have led us into thinking the soil was darker and more compact than it would have otherwise been. Although this problem is relatively minor considering the scale of our digging and our group focus on artifact collection, it is something to consider nonetheless.

Results
Even though no excavation was done on Tuesday, they were able to successfully complete the gridding of the Olin barn area and the garbage pit. This allowed the Thursday group to perform the successful excavation of 17 test pits. The artifact count per pit ranged from 0 to 1,196 artifacts. The type of artifacts that were found included slag, bricks and brick fragments, window glass, ceramics, wire, safety pins, a glass bottle, a metal ball, nails, charcoal, a metal latch, building concrete material, a piece of plastic with “CHINA” printed on it, and wall hooks.

Next week, we will continue with the excavation of the remaining test pits to determine the areas with the greatest concentration of artifacts. This will help us determine the best place to focus our future digs. Once we are done excavating our test pits, we will need to backfill each hole. We will return the sifted-through dirt to the earth, reducing the risk of future land users from falling into hidden holes.

Week 4 – Site Clearing/Preparation
Created by: Violet Wright, Sela Nesin, Fernando Jimenez
Introduction
This week we started work at the site for the first time. Our goals were to clear the site, and to investigate which part of the site would be the best site to continue excavation.
The main work was clearing the brush that had grown since the last time the site had been excavated in 2023. Invasive honeysuckle was the most common plant at the site, so the Arb director was fine with our class clearing the area. The TAs had come to the site prior to the lab, and they had worked to clear a small section of the depression that we believe, based on archival data, to have been the barn. From this cleared area, on the south end of the barn, we started working our way north with clippers of various sizes. At the same time, another group worked to clear the machine shed, working their way south from the ramp. Brush was piled to the side of the cleared area, out of the way of the potential excavation sites. Some of these piles had to be moved during the second lab period, as they began to be in the way of the areas that needed to be cleared. During the second lab period, one of the main goals was to find the outline of the machine shed floor; groups also investigated the large collection of tiles along one side of the shed.
Previous classes had located a large trash midden at the south end of the barn, which had a large amount of surface artifacts. While most of the lab group worked on clearing out honeysuckle, a small group began flagging those artifacts by sticking a pin flag in the ground next to them. Features were marked by two pin flags in an x.

Figure 1. Flagged artifacts on the midden at the south end of the barn depression. (Photo Credit Violet Wright)
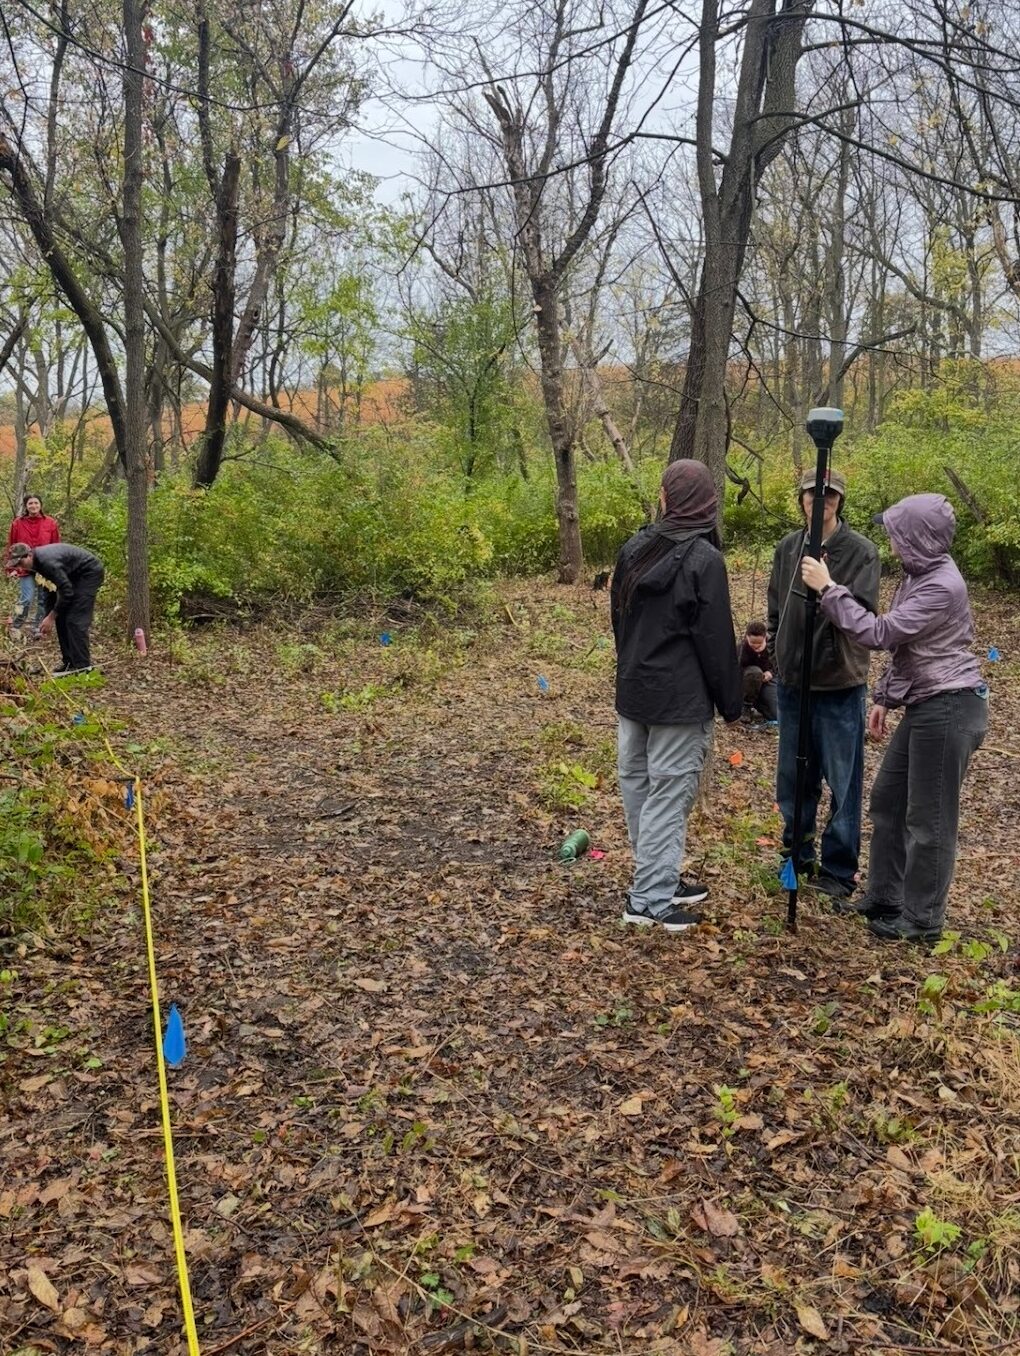
As the artifacts were marked, a rotating small group also began mapping some of the artifacts, using a rover and base point to get a precise location. The rover is a mobile pole that uses its relation to a base station to find the precise geolocation of the point by interacting with at least four satellites.

Figure 2. Violet uses the rover to practice mapping artifact points, observed by Ari (TA), Eve, and Jolin. (Photo Credit Sela Nesin)
To determine the position of the object, a satellite bounces a signal off of a receiver on the ground, then determines the distance between that point and itself. This gives a sphere of points where the object could be. When three satellites are used, there are only two possible points, and the point closer to the ground is used to determine your location. This point can have a wide margin of error, since the signal can be deflected or disrupted in various ways in the atmosphere. The more satellites that the receiver is in contact with, the more precise and accurate the location is. On Tuesday, the rover was in contact with more than forty satellites. This mapping was only carried out during the Tuesday lab, due to technical difficulties during the Thursday lab, and it is not a comprehensive map of the artifacts and features of the site. The resulting map can be seen below.
Results
A sizable number of surface artifacts were found while clearing the areas of the barn and the machine shed. Some of the most common artifacts found in the barn area were bricks and slag. Slag is generally the byproduct of smelting metals, but in this case it was likely waste produced from burning coal. We were able to reasonably assume that the bricks at the site were not from the barn, but were dumped there to be disposed of at a more recent date. Most of the items discovered were likely pieces of trash that were brought to the area of the barn after it was abandoned or demolished. The group working in the machine shed area found similar artifacts, such as bricks. Both groups also discovered a number of ceramic sherds, as well as unidentified rusted metal objects. In the barn area, small glass bottles were found, however in the machine shed, the group found an unidentified glass shard as well as a beer bottle. As the barn was further cleared, a few artifacts were found which seemed unassociated with the midden, including flat shards of glass that seemed to come from a window rather than a round bottle.

Figure 3. Unidentified metal object found in barn depression. (Photo Credit Sela Nesin)

Figure 4. ArcGIS map of the artifacts found by the Tuesday lab section, with potential excavation areas marked in purple.
While the Thursday group was clearing the machine shed, they found cow bones, an indication that livestock was present in the area. They were also able to find concrete blocks and tiles that seemed to have been left by past construction workers. Some of the tiles were staked, with others sideways in two rows. Many broken tiles were in the area as well. Future excavation in this area will look to discover more about the tiles and sustainability practices.
In addition to looking for artifacts, the groups were able to clear large sections of the site. The main discovery in clearing was that the barn might have been larger than previously thought. The Tuesday group was able to find this out as the flat land continued on when clearing past the initial border. The Thursday group cleared even further and was able to get a good idea of where the barn sat.
Based on the data found during the lab, the class plans to excavate in both the machine shed and the barn depression area, shown in the map above. Most final project groups will be involved in these excavations, attempting to find out more information about the land use over time. Excavating the site past what was revealed in past projects could give new insight into the history of the Olin Farm and farming at Carleton.
Week 3 – Survey of the Arboretum Prairie
Created by: Eva Mazullo, Samir Singh, and Noelle Paek
Introduction
This week we had our first experience collecting archaeological data in ARCN246. On Tuesday and Thursday, both lab sections practiced a pedestrian survey in the prairies of the Arb. Our professor and TAs divided us into four groups of six students, each responsible for surveying a section of the prairie. In class, we had learned that our professor often takes classes to nearby prairies during the first few labs, because they are accessible for beginning archaeologists. With little previous experience in archaeological survey, students commonly don’t know exactly what to look for. For that reason, this prairie, with its minimal impediments, is a perfect starting point. However, while students have been surveying Arb prairies for many years, the specific grids we covered had not been sampled by ARCN246 classes in the past. This made all of our finds especially exciting. Our discoveries, from ceramic plates to animal bones, helped us learn that doing archaeology in the Arb provides insight into the past activities of members of our town.

Figure 1: The partly cloudy conditions of the Tuesday lab’s survey
Before we began our survey, each group filled out a form describing the context of our lab – the weather conditions, the visibility of the field, the type of soil we were working with, and the initials of each member of the group. Next, our professor and TAs spread us out evenly with about 10 meters between us. To survey the land, each group member walked an equal distance, looking for features, artifacts, and ecofacts that lay in our designated transect. Whenever we came across an archaeological find, we placed a pin-flag in the ground. After everyone had surveyed their own transect, groups investigated all of their flags together in order to determine the validity of our finds. Our approach was an example of systematic sampling. Although it is likely that we missed hidden artifacts in the 10 meters between each student, our job was to maintain focus on our assigned transect.
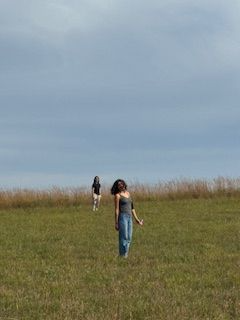
Figure 2: Grid 2 members Noelle and Eva enjoying their data collection (note the spacing between them – systematic sampling!)
In addition to providing us with experience practicing pedestrian archaeological survey, this lab also equipped us with technological skills that professional archaeologists use every day in their work. If our team decided a find was a feature, artifact, or ecofact, team members took turns recording it in the ArcGIS app, giving a short description of the find and marking its location. After completing the survey in the Arb, we returned to our classroom and continued getting comfortable with ArcGIS. We practiced making maps that visually represented different information, focusing on the “Points_2025” and “Survey_grids_2025” layers. The following sections will elaborate on our finds, provide evidence and context through the maps we created, and reflect on our first experience carrying out archaeological research.
Results
In total, our class found 26 artifacts, 17 ecofacts, and 33 features between all four grids. We collected this data from the survey unit forms each team filled out, rather than the main points table on ArcGIS. We made this choice because of inconsistencies in the raw data on ArcGIS, a point that will be explained further at the end of this report. After examining the data, we noticed that each grid contained all three types of archaeological evidence (artifacts, ecofacts, features), with a roughly even distribution. There were eight artifacts in Grid 1, with particularly interesting finds including one piece of plastic and two pieces of ceramic plate. In Grid 2 there were five, including a burnt bamboo pole wrapped with metal wire. Grid 3 had eight artifacts, including a long piece of orange, plastic cord. Grid 4 had five artifacts, including a piece of twine for bailing hay and a jump starting kit tag. In terms of features, the three most common were metal posts (10) and steel caps (3) used for prairie research and marks made by tractor tires (11). Grid 1 had eight features, including a metal post and steel cap. Grid 2 had 11 features, including tire impressions and metal posts. Grid 3 also had eight features, including a steel cap and a metal post. Grid 4 had five features, including a prairie plot and track impressions.

Figure 3: Comparison of number of features, artifacts, and ecofacts across all four grids
While writing this report, our group discussed the information that our archaeological finds conveys. We came to the conclusion that the tire tracks and ceramic plates were our most interesting and thought-provoking finds, because they give us a glimpse into the way the Arb prairies were used in the past. More specifically, encountering the tire tracks in our survey reminded us about the hard work that goes into maintaining the Arb. In class lectures and readers, we’ve examined different ways in which farmers work on the land, but identifying traces of their work firsthand in the Arb gave us a better understanding of the behind-the-scenes work that happens in the Arb.
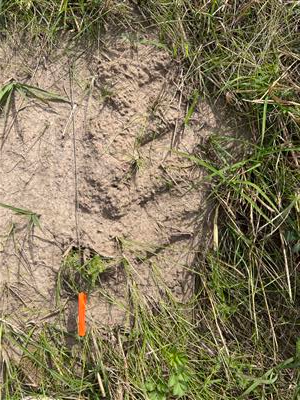
Figure 4: Tractor tire marks found in the Grid 2
In Figure 5 below, we can see that the majority of the tire marks were in Grid 2, with only two in Grid 1 and one in Grid 3. This could be an indication of a few things. On one hand, our data could be completely accurate, revealing that the tractor was most frequently used in Grid 3. Though unlikely, an answer for this strange pattern could be that the farmer driving the tractor only drove through Grid 3, or covered each grid at a different time. Either of these possibilities would logically lead to the high concentration of tire tracks in a singular area that we noticed. On the other hand, this distribution could also very well be the product of some groups failing to recognize what the impressions looked like. Differing levels of visibility due to length of grass might have also impeded surveyors from flagging the impressions. Identifying whether the pattern is tied to the farmer’s activity or our class’ oversight would require a more detailed analysis than our data offers.

Figure 5: The distribution of tractor tire impressions across all four grids
The ceramic plates found in Grid 1, shown in Figures 6 and 7, also inspired us to reflect on past usage of the Arb, albeit in a different way. During our lab debrief, our professor explained to us that this style of ceramic plate is consistent with tableware uncovered by previous ARCN246 classes during their excavation of the Women’s League Cabin, which is located in a nearby part of the Arb. Just as our discovery of tire tracks reminded us of the presence of farmers in the Arboretum, the ceramic plates provoked questions about past activity that occurred in the prairies. How did these dishes get left behind here? Who left them? Were the dishes used exactly in the spot we found them, or were they left there unintentionally? The uncertainty of specific uses of our finds has given us real experience tackling the kind of unsolved questions that archaeologists grapple with in their fieldwork.


Figures 6 and 7: Ceramic sherds found in Grid 1
Additionally, the plates were of particular interest because they were the first pieces of ceramic evidence found by archaeology classes surveying this area of the arboretum. The plate pieces suggest much earlier usage of the Arb prairies than the other artifacts and features we found. This shows that the surface can contain mixed contexts, and results must be considered accordingly. Though we didn’t use absolute dating methods to figure out the exact timeframe of the plates, our group agreed that the tire marks can be used as markers for relative dating. Their preservation in the environmental conditions infers recent human activity, whereas broken ceramic plates imply activity from long ago.
Reflection
Since we gathered our data from the raw, uncleaned data found at the bottom of each team’s survey unit form, we encountered some issues when comparing our numbers with the values entered in ArcGIS. Groups entered their data into a table with 7 categories on the survey unit form. The categories provided on the form did not correlate with options on ArcGIS as students created their own classifications, leading to inconsistencies across all four grids as finds were omitted if they were not placed into the correct category. Another issue we faced was sorting through our finds when each team had a different method of labeling them. Our professor instructed us to title our finds with our names on ArcGIS, but once each team split up, this became hard to enforce. As such, when we reconvened to discuss our data, we were met with an unorganized array of data: some artifacts had been titled with the name of the student who found it, while others were labeled with the object itself. While our data collection strategies were uniform in each individual grid, maintaining consistent practices across all four grids proved to be especially difficult. Inconsistent data collection aside, it was rewarding to learn about past activity in Carleton’s Arboretum through our survey of artifacts, ecofacts, and features in the prairie. Moreover, sorting through inaccurately labeled finds forced us to truly conceptualize the work we did in this lab.
While initially many of us were slightly disappointed by the lack of artifacts that we came across, our Week 3 Lab was definitely a beneficial learning experience. We gained a much more realistic understanding of what fieldwork entails. As we remarked earlier, it’s one thing to read about archaeology in a textbook, but to walk out to the Arb and put our lessons to the test proved incredibly worthwhile. Archaeology is not all about making glamorous and abundant discoveries across each site; rather, it requires a high degree of patience and willingness to accept that even the absence of artifacts can be significant. Throughout this process, we were constantly reminded of our professor’s famous phrase: “It’s not about what you find, it’s about what you find out.”
Week 2 – Arboretum Tour
Created by: Zoe Cheng Pinto, Marina Deutsch, and Alec Coy-Bjork
Introduction
To kick off our archaeological pursuits at the Olin Farm this term, both lab periods received a short lecture and a three-hour tour through the Cowling Arboretum from the Director of the Arb, Nancy Braker. On this trek, Nancy led us to various locations, including the site we’ll be excavating this term, the Olin Farm, and the site of the Women’s League Cabin, where excavations were completed last year. Through Nancy’s expertise and the skill of archaeological observation we’ve been sharpening in class, we were able to consider the historical and present-day significance of the locations we visited, as well as appreciate the stunning and vast nature that Carleton’s Arb offers to visitors.

(Photo by Alec Coy-Bjork)
Lecture
Our adventures began with a quick, 15-minute lecture from Nancy at the Arb office. Along with a brief history of its founding and background, Nancy noted how the Arb has always been a place she’s loved going, especially as a student. For many people, the Arb has been a place for respite from busy campus life, a lush landscape where one can connect with nature and friends—a sentiment that would be further confirmed when we later discussed the Women’s League Cabin. And yet, though today it’s mostly frequented by students looking for a break and Northfield citizens getting in some exercise, the history it has is rich and multifaceted, holding significance for different groups of people throughout time. We caught a glimpse of this during the lecture, when Nancy showed us a map detailing Minnesota’s vegetation and biome distribution, surveyed before and after the Civil War, to give buyers a more informed choice when it came to selecting which plot of land they desired. Our understanding of occupation across the Arb would continue to deepen as we left the Arb office and began our walking tour. (Figure 1)
Olin Farm

(Photo by Zoe Cheng Pinto)
After leaving the Arb office, our first stop was the Olin Farmhouse. (Figure 2) Carleton College purchased the Olin farm in 1916, a common practice among residential colleges. Many colleges purchased nearby farms to help feed the students who lived on campus. Research from previous archaeology classes into the history of the Olin farm tells us that Carleton students worked on the Olin farm as part of their work-study. Old insurance maps of the farm indicate that it originally had a hod shed, chickens, a granary, and a machine shed. We only observed the Olin house from the path to respect the privacy of the current resident, who is a Carleton biology professor. The Olin house is the only remaining preserved part of the farm. We left the path to visit the remains of the machine shed, a little way down the path from the house. This was the first archaeological feature that our class has seen!

There were concrete remains of the ramp, and concrete blocks jutting out of the ground, already overgrown with moss and other vegetation despite the recent excavation completed there in 2022. (Figure 3) It was clear that this feature was manmade rather than naturally occurring from the perfect rectangular shape of the concrete blocks. Another indication was the artifacts that we found. We found remnants of plates, wire, and machine parts. (Figures 4 and 5) We learned that the site was used as a dumping ground to throw away things that could no longer be fixed or reused. It was common for farmers to choose a site on their land as a spot for refuse piles because garbage removal services were not common until the 1960s.

plate with Carleton colors.
(Photo by Alec Coy-Bjork)

(Photo by Alec Coy-Bjork)
Wildlife
Along our arb tour, we learned about the various wildlife that inhabit the arb. We stopped to see the sandbank of the Cannon River from the trail, and learned that the river is home to freshwater mussels as well as otters. (Figure 6) Historically, there was a large population of different species of freshwater mussels in the Cannon River, which was unfortunately reduced by the freshwater pearl industry. As a result, other sites in Minnesota have large middens of exclusively mussel shells. Both humans and raccoons harvest the mussels for food; while humans are able to cook and eat them easily, raccoons must drag the mussels into the woods, where they leave them to die. After that, the raccoons are able to open and eat them.
We stopped at the wetlands, marked by a limestone bench with a small white mushroom next to it. The wetlands are a breeding ground for both salamanders and frogs. We learned that during the frog’s mating season in spring, the tiny frogs are so loud you can’t have a conversation!
Another large wildlife population in the arb is the white-tail deer. There are 50-100 deer per square mile. We visited an exclusion fence that was built to keep deer out and prevent them from eating shrubs and buds of young trees. (Figure 7) The land near the enclosure was once a pine plantation, and has now been replanted with native trees such as oaks and cherries. Now the arb crew protects the young plants by putting plastic tubes over the trees.

bank.
(Photo by Alec Coy-Bjork)

(Photo by Alec Coy-Bjork)
Along most of the path, we saw bushes of bright red berries. (Figure 8) These were the berries of the honeysuckle, an invasive species native to Eurasia. They were originally brought to Minnesota by settlers as an ornamental plant, but soon spread everywhere without their native insects and diseases to keep their population in check. Now the arb crew is working on removing them, but they can be found nearly everywhere in the arb in many places around campus.

(Photo by Zoe Cheng Pinto)
Another invasive species common in the arb is buckthorn trees, which are very difficult to kill. These trees produce berries called Rhamnus cathartica, named after the word catharsis. We learned that the berries are named after the effect that the berries have on humans who eat them, which is a cathartic expulsion of one’s bowel contents.
Women’s League Cabin
At our furthest stop during the tour, we stopped at the site of what was previously the Women’s League Cabin, located near the northern tip of the Arb. Nancy described some of the Cabin’s history, starting with its construction in 1938 as a retreat for female students. During Nancy’s time at Carleton, the cabin was available for booking, and was a popular spot for weekend retreats and parties. We learned that the site still attracts partygoers relatively frequently, even though the cabin itself has been long-since demolished. Nancy observed that sites of human activity (even abandoned) seem to attract other people, a good phenomenon to keep in mind when conducting archaeological research. We saw a number of features, including a set of stone steps and a patio, as well as a cooking station covered with rocks. (Figure 11) We also noticed artifacts such as an rusted pieces of metal, glass bottles and an animal bone, and Sam briefly linked the finds to artifacts her class had excavated the year before. (Figures 9 and 10)

(Photo by Marina Deutsch)

(Photo by Alec Coy-Bjork)

(Photo by Alec Coy-Bjork)
Summary
During our first lab, we learned quite a bit about all of the people who have worked in and stewarded the Arb throughout Carleton’s lifespan. Through controlled burns, the creation of exclosures, and fights against invasive species, Nancy and other members of the Arb staff have protected the Arb as a sanctuary for Carleton students and the greater Northfield area for generations. As such, we want to match that care with just as much respect and consideration as student archaeologists.