This page collects the weekly blog posts written by students over the course of fieldwork during the Fall 2024 field season. These blog posts detail each of our weekly labs, including student summaries, reflections, photographs, data, and interpretations.
Posts appear in descending chronological order, with the most recent post appearing at the top of the page.
Fall 2024 Field Season
Week 10 – Community Day
By Ella Parke, Isabel Gable, Gerardo Vega Diaz
Introduction:
This week, Community Archaeology Day took up our lab block. It was our way of sharing all of the research we have done on the Women’s League Cabin with the Northfield community. Each group had a station to share their research with interactive elements and a poster. The Northfield Public Library was also at the event, displaying books relating to archaeology. Additionally, there was a station with artifacts for the public to identify. Community Archaeology Day wrapped up our methods and lab course by giving us a deeper understanding of the theme for Week 10: Presentation and Outreach. It also connected to the reading we read for Tuesday titled “Lessons from the Past.”
Methods:
For the set up of Community Archaeology Day, we split groups between the classroom and the Anderson Atrium. At the Anderson Atrium entrance, there were people introducing the event and giving handouts. Guests visited each presentation, and the students summarized their research findings. Many alumni, facility members, and friends of students visited the presentations. For each booth, groups had a poster set up on an easel, and there were different interactive activities for the guests to view. This setup allowed students to have multiple media formats for displaying their information. In our readings on outreach and presentation of archaeological finds, we learned that it is especially important to emphasize connection with the stakeholders of our project such as women who are Carleton alumni, the Northfield community, and current Carleton students.
Classroom Layout:
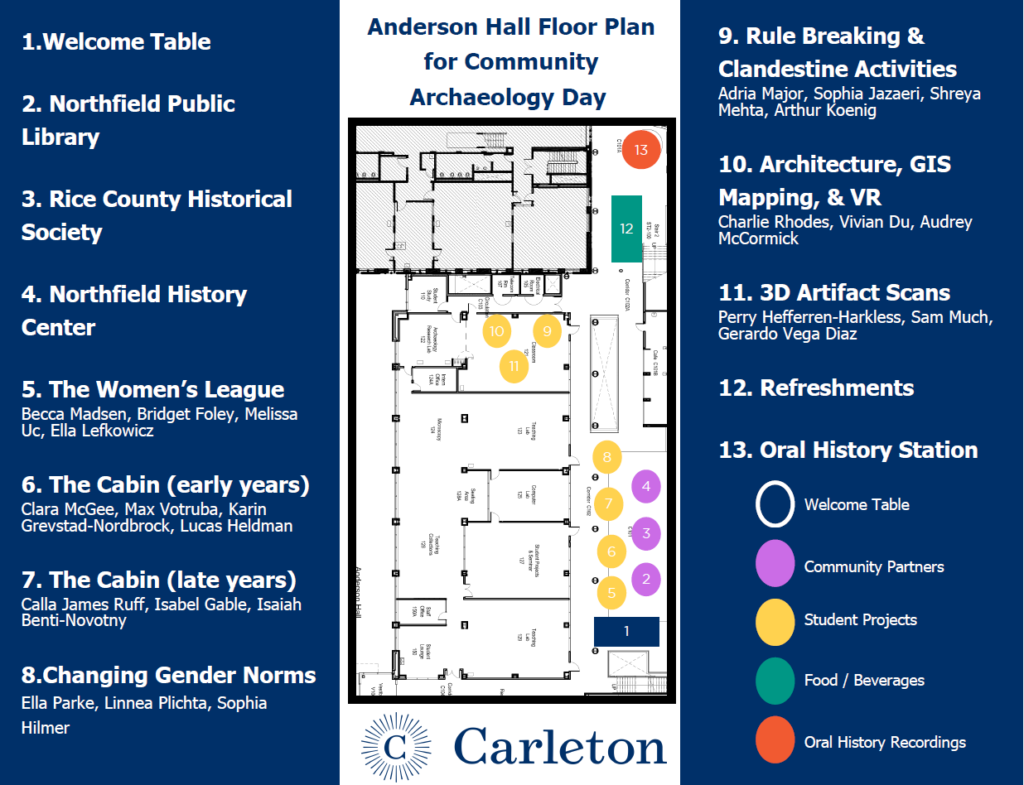
Since we had thirteen different stations, Community Archaeology Day needed to be split between two different locations: the Anderson Atrium and our classroom. Eight of the stations were in the Atrium including both presentations from our Archaeology 246 class and tables from the community partners: Rice Country Historical Society, Northfield History Center, and the Northfield Public Library. There was also a station for Oral History Recordings in the back for visitors to interact with.
First Station: The Carleton Women’s League

This group had a poster displaying the research and artifacts that were found during our excavation of the Women’s League Cabin. The artifacts connected to their presentation as they showed physical proof of women’s presence at the cabin. They also had an audio station that played voice recordings of alumni they interviewed about the Women’s League.
Second Station: Women’s League Cabin Early Years
The second station was the “Women’s League Cabin Early Years,” which displayed images of the cabin’s beginnings and documentation of how the Women’s League found support to build the cabin. These images and documents were printed out and displayed on computers.

Station Three: Women’s League Cabin Late Years

The third station was titled the “Women’s League Cabin Late Years,” which discussed what the cabin was like from the 1970s through the 1990s. This group discussed the transfer of ownership from the Women’s League to the Natural History Club and finally to the dean of students. They looked at how the usage and state of the cabin changed due to ownership. The cabin went from being a getaway for female students before 1970 to a party spot for both men and women beginning in the early 1970s.
Station Four: Changing Gender Norms.
This station focused on how gender norms at Carleton were evolving in times of wartime, specifically World War II and the Vietnam War. Their information was presented on a poster and through artifacts and documents that were laid out on the table. The artifacts showed female presence at the cabin and displayed changing gender roles. There was also a collection of metal scraps, which connected to the wartime since they were rationed at the cabin during World War II.


Fifth Station: Cladestine Activities: Rule Breaking
This group focused on the clandestine activities and rule breaking that occurred at the cabin. For example, vandalism and littering were common.
Station Six: Removal, Architecture, and GIS Mapping
This group used a projector to show how they used GIS to plot down and estimate the location of the Women’s League Cabin.


Station Seven: Digital Artifact Collection
This station used computers to display part of their final project. It included a digital database of all archeological artifacts found within the boundaries of the class. They 3d scanned the items and displayed them on their laptops. Furthermore, they kept an iPad on hand to show visitors how to 3d scan objects.
Results:
Interacting with the public helped students better understand their research topics. Visitors also provided insight into what Carleton was like during the days of the Women’s League Cabin. For example, many people shared their thoughts on what the Women’s League Cabin was like while it was around. A previous director of the Carleton Arboretum said that when they removed furniture from the cabin it was covered in rodent marks. This shows that rodents were involved in the demolition of the cabin. They also noted that furniture and other parts of the building may have been moved during demolition, which could account for where the foundation went. Another visitor said that they did not remember the rules for women at Carleton being as coercive as their female counterparts did. Additionally, another alumni challenged the presenters to consider unspoken rules in their research. Moreover, many people who visited were also able to identify themselves and others in photos. Furthermore, students improved their presentation and public speaking skills. Additionally, they enhanced their understanding of archeology by explaining their findings to visitors.
Discussion:
This week’s lab connects to our class reading “What Makes Archaeology Useful as Well as Exciting? It Offers Lessons from the Past” by Shadreck Chirikure. In this reading, Chirikure discusses why archaeology is a relevant field to study: it offers lessons from human experience. During Community Archaeology day, we were able to connect to our college’s history and members of the Northfield community. Furthermore, alumni who were at Carleton during the time of the Women’s League Cabin were able to tell their personal histories to us, which gave us a more intimate connection to our research topics. Our discussions with community members and alumni taught us valuable lessons about what it means to be a Carleton student and member of the Northfield community.
Week 9- Artifact Analysis
By Sophia Hilmer, Clara McGee, and Sam Much
Introduction:
This week we had our last official labs before Community Archaeology Day. We worked on artifact analysis which meant we went through individual artifacts and entered key details about each one on our database. In order to better understand the context that each collected artifact reveals, we did research on those with the most identifiable details.
Methods:
We began the lab by discussing how archaeologists use different tools to identify and date artifacts. In particular, the Tuesday lab cohort used the portable X-ray fluorescence machine (pXRF), to examine the elemental composition of each artifact. They also used electrolysis to remove rust from some metal artifacts. Both lab cohorts did artifact analysis on glass, ceramic, and metal artifacts. This entailed weighing each artifact individually, measuring maximum and minimum thickness, and measuring base and top diameters. We also classified the artifact type:
- Glass: jars, bottles, window panes, cup,
- Metal: can, lid, foil, cast iron, pull tab,
- Ceramic: teacup, plate, dish, pot, bowl.
Within these categories, we classified the part of the artifact:
- Glass: body, base, lip, insweep,
- Metal: church key, zip top, soda, solder dot, and more generally, rim or lid,
- Ceramic: base, rim, body.

Further details were also recorded including material, color, and maker’s mark. We will expand more on the methodology for each artifact type below. We then entered this information into our Excel database. Our goal was to gain more insight on the composition and details of each artifact. In doing so, we were able to identify key characteristics like the time period the object was used, the maker’s mark, or the value of the object.
Materials:
We used different materials for each method of analysis. For electrolysis, we used buckets with water and baking soda, wires, and batteries. To analyze the elemental composition of artifacts we used the pXRF (portable X-ray fluorescence) machine, pictured in Figure 2. For the standard analysis of artifacts we used a scale, a diameter measuring sheet, pictured in Figure 4, and a ruler or caliper.
Tuesday:
On Tuesday, we were split into groups, a ceramics team, an electrolysis team, and two teams performing glass analysis. In the ceramics group, we were particularly focused on one artifact. We were working under the assumption that it was a teapot. This assumption was based on the shape, the presence of a handle base, and the inner lip of the rim that could hold a lid. It is white with a gold rim, a blue band, and pink floral accent. As we had a complete section of the pattern around the cup, we thought we could date the object based on the pattern. After quite some time researching, this turned out to be a dead end, and so we went to the pXRF. What we needed was the composition of the glaze or the paint as anything (particularly anything white) made before 1978 in the United States is likely to have lead as part of the glaze composition. We also tested the gold on the rim to see if it was imitation or genuine gold. The pXRF works by exciting the electrons of the target material with X-rays, which causes the elements in the object to fluoresce at specific frequencies. The machine reads this and determines the composition of the artifact. The information can be put into the database afterward.
For the last section of the lab we worked on our final projects.

Thursday:
Similar to Tuesday’s lab cohort, we split into different groups. The group analyzing ceramic used the methods described above to enter information into the database. This group also categorized similar sherds into individual bags. For example, we had bags for a pale green plate, a porcelain teacup, and a bowl painted with a leaf design. We also classified the ceramic type; the two most types we identified were porcelain and stoneware. To do this, we examined the paste color, that is, the color of the ceramic underneath the glaze. Usually, a smooth white paste indicated that the ceramic was porcelain while a coarser gray or cream color indicated that the ceramic was stoneware. When measuring the diameters of the ceramic, we also determined the percent of the original vessel. We also paid attention to indications of a maker’s mark. In particular, we found that the pale green plate was made by Universal Potteries, Inc. and the specific line of dishware was called Ballerina, as seen in Figure 3. These plates were produced in the 1950s which tells us that the midden in Unit 1 was in use after then.


Additionally, one of the groups analyzing glass used other analysis methods specific to such; the origins of most glass fragments could be identified by factors like shape, color and thickness. Glass belonging to bottles or jars was curved and thick, windowpane glass was thick and straight, and lightbulb glass was very thin. Due to the lack of makers’ marks and incomplete condition of many fragments, precise dating was difficult, with only the bottle seams and color of the glass to go off of. However, artifacts that included makers’ marks allowed for far more precise dating; for example, a bottle base was found to be made by Brockway between the 30s and 40s because of the logo style and lack of a date code, which became required by law in the 40s.
For the last part of the lab we worked on our final projects.
Results and Discussion:
Tuesday:
We found that the teapot’s glaze did indeed contain lead, along with ruthenium and rhodium as the next largest contributors at 12% each. It also contained iridium, palladium, and zirconium. The platinum group metals (ruthenium, rhodium, palladium, and iridium) are most likely used to provide protection against corrosion, as the platinum group metals are highly stable and corrosion resistant.1 The lead comprises the pigment of the glaze while the zirconium acts as an opacifier.2
1 Zientek et al 2017
2 Naher 2008

The rim of the vessel was found to be 23k gold, with 1.4% iron, 1.2% ruthenium, and .6% zinc.

Tuesday was a lesson in patience, persistence, and practice. We all got better at our respective analyses over time, but it did take trial and error. Using the pXRF took a few tries, as we often weren’t holding the trigger down long enough or had issues positioning the item being scanned. Even though we didn’t get a specific date for the teapot based on the pattern, the confirmation of it having lead as part of its makeup helps corroborate some of the other dates from Midden 1’s diagnostic artifacts, such as the 1953 Coca-Cola bottle found at the same level.
Thursday:
Similar to Tuesday’s lab cohort, we improved with time. With practice, we got better at figuring out which details were useful to analyze the artifact, becoming more efficient at entering data into Excel. Overall, artifact analysis gave us a rough idea of when that object might have been used at the Women’s League Cabin. Since most of the dates we found were before 1970 (Figure 7), we can surmise that the majority of the artifacts were used at the cabin when it was still the Women’s League Cabin (1939-1970).

Week 8
By Vivian Du, Melissa Uc, and Max Votruba
Introduction:
Week 8 was our first full week in the classroom working with the artifacts we had excavated in the prior weeks. Tuesday’s lab cohort worked to finish cleaning the artifacts that Thursday’s cohort began Week 7. Thursday’s lab cohort split with some members remaining in the classroom focused on counting, weighing, subsetting, and logging artifact bags into an Excel database while other members ventured back to the excavation site one last time to finish mapping it on ArcGIS. Using this three pronged approach to analysis and beginning to categorize artifacts, we have begun our curation of the site and gained an even better hypothesis and story for how the area may have been used.
Methods and Materials:
Tuesday
Tuesday’s lab began with an overview of rules and methods for cleaning artifacts. They go as follows:
- Pot sherds and glass can be cleaned using water and brushes.
- Metal and other materials such as leather must be cleaned using only brushes.
- You must keep track of which bags artifacts come from in order to maintain context.
- Clean and reuse bags when possible.
- Have fun!
After the overview of the rules and methods, the cohort split into groups of 2-3 students and began cleaning. The materials used for cleaning consisted of the following:
- Brushes
- Bowls to hold water
- Plastic trays to clean over
- Paper towels to hold drying artifacts
There was one group focusing on glass shards from Unit 1, one group focusing on pot sherds from Unit 1, one group focusing on large artifacts from Feature 1, and one group focusing on metal pieces found in Unit 1.

Figure 1: Student using brush to clean ceramic.

Figure 2: Large glass shards waiting to be cleaned.
As we worked through the bags of artifacts, we found ourselves bonding over the communal process of it all. Music played in the background as we chatted and scrubbed. Many students found it exciting to be able to see the artifacts in a new light. It made what we found seem more real. The process of cleaning was relatively straightforward; however, a problem that arose many times was the discovery of the wrong artifact type coming from a specific artifact bag. For example, the group cleaning glass from Unit 1 would find tiny potsherds mixed in with the glass shards. Groups had to be diligent and transfer these wrongly sorted artifacts to the proper group.
Towards the end of the lab, certain groups finished before others. To wrap up, a group had to clean out and dry the plastic bags so the clean artifacts would be kept in clean bags, wash out the water bowl (if applicable), clean the tray, and scrub the dirt out of the brushes. Since some groups finished before others, students who finished early joined the metal brushing group because there were a lot of metal pieces to clean.

Figure 3: Students brushing off metal pieces.

Figure 4: Clean artifacts back in a clean bag.
Thursday
The Thursday group that was focused on data entry and collection started out by splitting into pairs of two going through artifact bags and getting information from them to put into the database. This involved opening each bag and taking all of the artifacts out and counting them. The typical way of doing this is organizing artifacts from the bag into groups of five and counting them that way to reduce error. After the count was finished, the groups weighed the materials in the bag and entered all of the relevant data into the spreadsheet. The typical entry contained information like the project, site, feature number, unit number, level number, context, material, bag number, date of excavation, initials of excavators, initials of lab enterers, bag count, bag weight, and observations. After each bag was entered into the database, we went through and verified that each bag was logged with the correct description and was assigned a unique bag number to be tracked later on.
Gaining this data and having it all in one place helps us to understand what we were able to learn about each excavation site as well as to quantitatively reflect on the materials that we collected as well as what they can say about the usage of the Women’s League Cabin site as a whole.

Figure 5: Artifact bags to be cataloged, organized by excavation site.

Figure 6: Karin, Lucas, and Arthur counting artifacts within a bag.
Mapping
Another group within Thursday’s lab went back out to our excavation site and collected a few other tentative control points than what we already had from October 29th. In consultation with the GIS Specialist Wei-Hsin Fu, we used the re-collected coordinates of important features for computer-driven georeferencing using ArcGIS Pro back in the GIS Lab.
First off, we set up the cm-accuracy Trimble receiver with an iPad and headed straight to the spots which needed confirmation based on previous georeferencing. This time, instead of asking Trimble to average 10 points in real time, we attempted to further increase accuracy by averaging 30 points. This means the data collector holding the receiver pole had to stand still at the point for the whole 30 seconds, while paying full attention to the bubble to make sure it was at the center and that the pole was completely vertical. The coordinates of the metal poles were collected by placing the receiver directly on top, with a person stabilizing it while squatting down to prevent blocking the signals. Subsequently, to confirm the scale of the floor plan, we also counted the number of tiles along both west and east edges of the patio and ended up collecting two more points at the 13th and 21st tiles from the north end of the patio. With the FieldMap app, we were able to add new points on the “Women’s League Cabin Control Points” feature layer and overlie them on top of the 1951 aerial photo as well as the floor plan. Adding color-coded legends, we specified what points had been taken a week ago and what had been taken this time around, resulting in the “Women’s League Cabin Georeferencing Work” Web Map. It is worth noting that a lot of measurement error could have easily occurred throughout the data collection process, but gladly the re-collected points turned out to be mostly in alignment with previous georeferencing results (see picture of Web Map in the results section).
In addition, we attempted to find the tile path leading up to the front cabin door (where the 2015 had set up an excavation unit) in hopes of locating more control points on the east side of the cabin. We also borrowed a 360 GoPro Max camera from ITS and took some 360 photos and videos of the site. We will edit the footage over Week 9 to hopefully stitch together a presentable 3D tour to be embedded in the course website.

Figure 7: Vivian collecting GNSS coordinates of the east metal pole of the fire pit.

Figure 8: Wei-Hsin, Vivian, and Charlie figuring out the relative locations of Unit 2A, the pine trees, and the original chimney. Photo courtesy of Audrey McCormick.

Figure 9: Charlie working with a probe, tape measure, and trowel; further into the picture are orange and blue pin flags marking where we suspected the front door tile path could have been.
Results and Discussion:
Tuesday
Tuesday’s lab resulted in all of the artifacts being cleaned off and ready to be sorted on Thursday. The only artifacts that did not get cleaned were tiny metal pieces that the lab decided to discard due to their probable lack of importance to the overall research. The process to clean all of the artifacts was a long one, but an extremely important one. It is imperative to view the artifacts in a clean state in order to maximize the amount of information the lab can glean from them.

Figure 10: Cleaned glass shards.
The artifacts being clean allowed for students to begin to research and attempt to date them. It was much easier to identify dates, logos, and brand names on items that were not caked in mud and dirt. The cleaning process taught the lab patience, diligence, and the value in caring for the historical items you find. Throughout the long process, we made sure to remember the final rule of artifact cleaning: Have fun!

Figure 11: Student researching a recently cleaned can.
Thursday
Upon the completion of the database, we are now able to organize and visualize the materials collected. Below are graphics made from the completed database, courtesy of Professor Sarah Kennedy.

Figure 12: Total Weight by Artifact Type. This graph shows a corroboration of all of our artifact types and what percentage of the total weight of all artifacts each material represents.

Figure 13: Total Artifact Count by Type. This graph shows the percentage of the total quantity of artifacts that each material represents.

Figure 14: Artifact Proportions by Unit. This graph shows what materials were found in each excavation unit.

Figure 15: Proportion of Artifacts by Unit. This graph shows what percentage of our total artifact count was found at each excavation site.
Through the creation of the database, the Thursday data entry group learned about a new part of the scientific process of archaeological study. One that is often arduous and complex. At times, we had to deal with duplicate entries in the database and the identification of these was confusing and frustrating. We learned about the importance of an organized system and a common understanding of procedure in archaeological projects.
Mapping
The lengths between control points around the patio turned out to be at least one tile off between what was depicted on the floor plan and in reality. We inferred that such discrepancy could have been either because the floor plan had been originally poorly calibrated or because the tiles had been shifted over the years of remodeling, demolition, and reuse. Based on the new control points along the east side of the patio, we concluded that Unit 2A happened to be located right at or just the south of the back entrance of the cabin—instead of at the northwest corner of the foundation. This could possibly explain why we were able to hit neither the foundation nor the chimney during our excavation of Unit 2A. If the floor plan is accurate, the foundation could be about 9½ tile length north of where Unit 2A is currently at. However, this would suggest that at least three of the pine trees north of Unit 2A now would have stood in the middle of the cabin, which is improbable if the trees are original from the last century. We have yet to double check with Nancy Baker on the age of these pine trees.

Figure 16: Tentative georeferenced floor plan with red dots denoting GNSS control points collected on October 29th and blue dots denoting those collected on November 7th.
We also poked around the northeast corner of the suspected foundation and came across a zig zag path of rocks. However, given the limited time we had at the site, we were unable to identify if those rocks were part of the tile path we were trying to find or simply random rocks from the backfill. Overall, even though the attempt at locating the front door was unsuccessful, we were relieved to have arrived at fairly satisfying georeferencing results with the floor plan scale and the few relatively accurate control points we had at hand.
Conducting mapping at the WLC site for our lab illustrated that archaeology was a collaborative undertaking and required everyone to stay consistent and patient. It is not uncommon to have to go back and forth between the site and the lab to compare front- and back-end work. All the time and effort we spend on a project like this is to improve data accuracy and inform in-depth analysis based on data as much as we can. Moreover, visualizing the data is important for engaging community members with our fieldwork and interpretations in an easily approachable manner.
Week 7: The Final Excavation and Initial Artifact Cleaning
By Isaiah Benti-Novotny, Perry Hefferren-Harkless, and Audrey McCormick
Introduction:
Tuesday ended up being our final day of excavation at the Women’s League Cabin site. We wrapped up our excavations of the fire pit midden (Unit 1), the trench (Unit 2), and the mapping, surveying, and collection of the second, larger midden (Feature 1). On Thursday, the initial plan was to complete excavation at the site. However, due to the rainy weather, we relocated indoors and spent lab time cleaning the artifacts we had gathered in previous weeks in order to identify them with greater accuracy in the future.
Methods:
Tuesday: Trash Midden (Unit 1)
We started by filling out the excavation form for the trash midden. Because last week’s Thursday lab had already taken level’s for our starting point, we were able to copy their ending layer as our starting layer. In previous labs, this midden had been excavated by level in Context A, but because of the locality of most of the artifacts found and the discovery of the barrel, we started to dig by context in context B in order to try and uncover the entire barrel and see how far down into the soil it went. We found many small metal pieces on the surface of the soil and made the executive decision to just put all the dirt in the bucket and find them during screening instead of spending time picking out every tiny piece that we saw. This allowed us to put all of our attention into finding the bottom of the barrel which was the main goal of our excavation. Instead of digging right next to the barrel and risking breaking it, we started by digging in a circle a couple inches around the barrel so we could pedestal it and keep it intact. We also did not dig the dirt inside the barrel for risk of it collapsing the barrel if that dirt was holding it together. After we had established a relatively deep ring around it, we then went in closer to remove the dirt next to it, which gave us an answer to our question…

Figure 1: Unit 1
Tuesday: Trash Midden 2 and Patio
Trash Midden 2: During the final excavation lab of the term, we did a variety of different things in the area of these second Trash Midden; sketch-mapping of the artifacts in the area, mapping the midden itself (finding where the furthest artifact is located in the area and marking down where the trash midden was covering), and collecting different artifacts found in the trash midden to try and recreate and put together said artifacts again. To go into more detail, sketch-mapping was done making use of the map created to define where the trash midden began and ended, and tracking where each artifact was located in the area of the midden. We made use of the map and multiple tape measures to track where an artifact was based on where it lined up on the tape measure, then using the map once again to draw a birds-eye view depiction of artifacts found in the midden.

Figure 2: Sketch Map of Second Trash Midden of WL Cabin
The collection of artifacts in the trash midden was not done by my group specifically but what I noticed happening was the collection and organization of similar artifacts; putting ceramics together, or gathering glass or metal shards. This assists in finding out what was thrown away in the midden itself and how they may have been related to one another. The last activity that was done within the second Trash Midden area was creating the map used to finish the sketch-mapping, and figure out where all the artifacts where located. We made use of multiple 10 meter long tape measures to mark down where the midden was, looking to where things like the furthest piece of trash was located and keeping the tape measures as straight as possible to make a solid shape for the mapping of the midden. The creation of this map, like mentioned above, was used in the completion of the sketch-mapping of all artifacts, and the locating of where every artifact was located for collection.

Figure 3: Glass Shards found in Second Trash Midden of WL Cabin.
Patio: The cleaning of the patio was a much simpler process compared to working on the second trash midden, specifically with how straightforward the activity itself was. We split up the sections of the patio area to work on and started clearing out the excess amount of dirt and debris that was on top of the patio bricks. Finding the corners of each of the patio bricks and moving excess dirt off of the patio to make it easier for mapping purposes. We were clearing off of the patio and marking out the furthest corners of the patio to make sure the patio could be mapped properly; finding out and charting where the patio covers the area of the Women’s League Cabin to discern things like where the cabin was located in relation to the patio for example.
Thursday: Artifact Cleaning and Identification
Artifacts were cleaned to the point of possible identification/reconstruction and re-stored in clean, labeled bags (see class spreadsheet for artifact ID). This Thursday, we were supposed to finish up our excavation at the Women’s League Cabin site, but due to the cold and the rain, we relocated to the indoor lab instead. We spent class time washing off the artifacts we had bagged and labeled during previous weeks, using toothbrushes, tubs of water, paper towels, and trays. My table was assigned the bag of broken glass pieces, and it took us the entire class period to get through all of it, even with extra help at the end from other groups who had finished cleaning their collections.

Figure 4: Karin and Vivian clean artifacts
Results:
Tuesday: Trash Midden 1 (Unit 1)
We had previously thought that the midden was just an unorganized trash pile. We had also theorized that maybe it was used as a one time dump site. The find of the barrel by last week’s Thursday lab changed this hypothesis and suggested that this midden was used as a regular dump site for the cabin, but was also organized rather than randomly strewn about. This increases the possibility that this midden was a trash receptacle for only the fire pit, while the larger midden was used for more and larger items. This could stress the importance for the cabin goers to have a clean appearance near the house with a nice environment while putting the more ugly trash pile further away and out of sight when people were staying there.
We found that the barrel did not go down that far, 15 cm to be exact, and that there was only a relatively thin circular layer of it remaining in the dirt. Because we saw that there was dirt directly under the metal ring we were excavating, we were then able to dig underneath it and reveal that there was only this thin part remaining. Screening the dirt yielded many more metal pieces than glass or ceramic, supporting the idea that we had found the bottom of the barrel. We also found a great deal of nails that could have held the barrel together and some orangish rust that was much less flat than the other metal pieces, which could point to the decay of the rest of the barrel.

Figure 5: The bottom of the barrel (image edited to contrast the metal from the dirt)

Figure 6: Artifacts from the screening process (metal, glass, rust, nails)
Tuesday: Trash Midden 2, and Patio
Trash Midden 2: The second trash midden was a discovery unto itself because of how it should be that there were multiple spots that were being used to discard trash and debris from the cabin. We spoke a little about how the second trash midden that was being investigated was most likely the main dumping area for residents of the cabin and the original trash midden being excavated (Unit 1) might have been a one-time dump from a single event hosted at the cabin, though this can be argued based on the existence of the large barrel buried under the ground in the midden. The second trash midden being the main dumping area was seen because of the variety of trash and debris located around the area, a larger amount of trash compared to unit 1, and how large the midden reached, covering a larger surface area than unit 1. Overall, the different artifacts that were found and sketch-mapped in the area of the cabin were most likely from multiple different dumps from many events/people of the Women’s League Cabin because of how, even if there was similarities in artifacts with glass shards or ceramics, they were so spread out around the area that they must have either had to have been tampered with before, or dumped multiple times in slight different parts of the midden.
Patio: The discoveries found in the patio area of the cabin were simpler compared to other areas around the cabin, what we did find though was that the cabin was larger than was expected compared to the original map found in the archives. The patio leading more into the general area of where the cabin was and not just located near the large pile of rocks or near the first trash midden (Unit 1). This shows how the patio, and the cabin land itself, was taking up more space than was originally thought of, going past where the trench was located during excavation for example. Another discovery that was made when clearing off the patio stones was that one of the stones was loose and very easy to move around, as if someone was fiddling with that specific stone or if it just became looser due to things like lack of use of the cabin area by people, or just the area decaying over time.
Thursday: Artifact Cleaning and Identification
The pieces vastly differed in size, ranging from about the size of a palm to smaller than a fingernail, and they were also very different shapes: there were many types of curved pieces, lots of completely flat bits which likely came from window panes, some bottle bases, and even a few with patterns like starbursts or diamonds. Most of them were clear, with a few pieces of amber color mixed in. We did very little actual analysis due to the length of time it took to clean all the pieces, but my table partner cleaned off a piece of a broken Pepsi bottle enough to identify the logo as one that dated from 1934-1951, and I managed to match the maker’s mark on a bottle base with the one used By Brockway Glass Co. during the 1936-1961 period.

Figure 7: Cleaned glass shards, including part of a Pepsi bottle
Due to time constraints, we weren’t able to attempt fitting any of the pieces together to see what their original shape might have been, but I think at least a few of them had a similar pattern in the glass itself, which suggested they had likely once been part of the same container. Other groups worked with different types of objects, ranging from broken ceramics/tableware to rusted metal cans and nails to chunks of concrete and stone. I was too focused on finishing my bag before the end of class to check if the other groups had identified any of their items, but I have attached pictures of the cleaned artifacts below.

Figure 8: Cleaned ceramic sherds

Figure 9: Cleaned metal scraps and glass shards


Figure 11: Cleaned metal can pieces

Figure 12: Cleaned ceramic plate pieces
Week 6 – Excavation Week 2 – In the Trenches…
By: Linnea Plichta, Adria Major, and Sophia Jazaeri
Introduction
This week we focused on continuing to excavate Units 1, a midden, and 2, where we thought the foundation is (Figure 1). We found a new feature and named it Feature 1 (Figure 2). We divided into multiple groups to excavate Units 1 and 2, map the new feature, and set out to find the water pump. Feature 1 is a second midden and is much larger than Unit 1. While looking for the water pump we were unsuccessful.
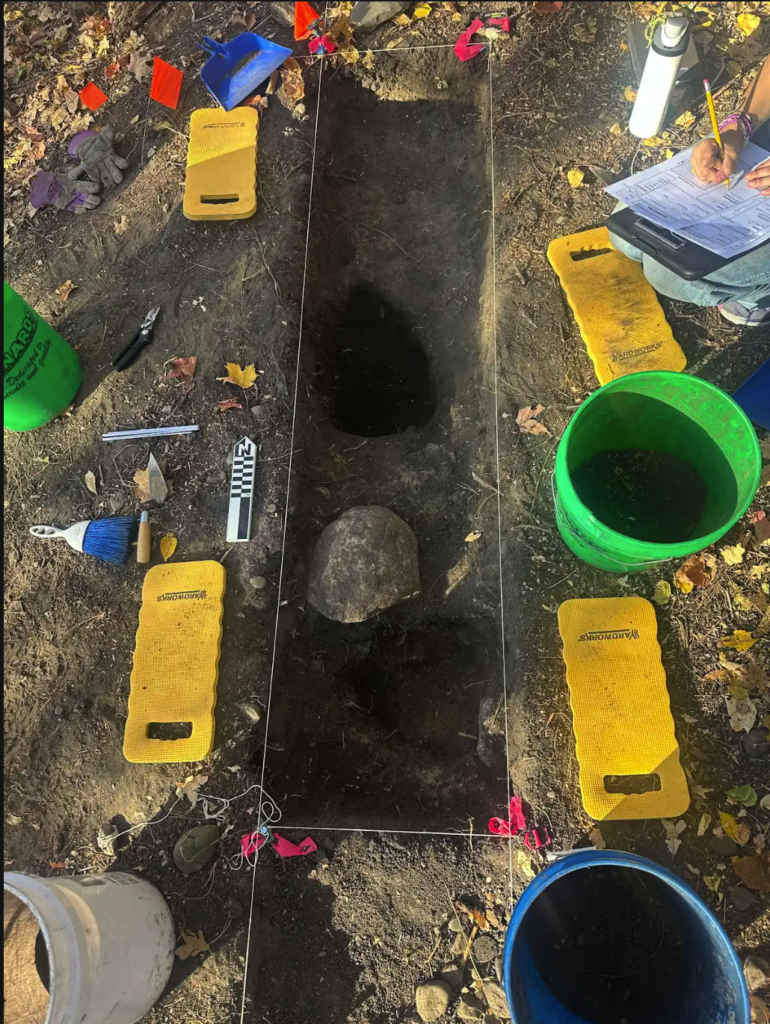
Figure 1: The Trench. Unit 2A
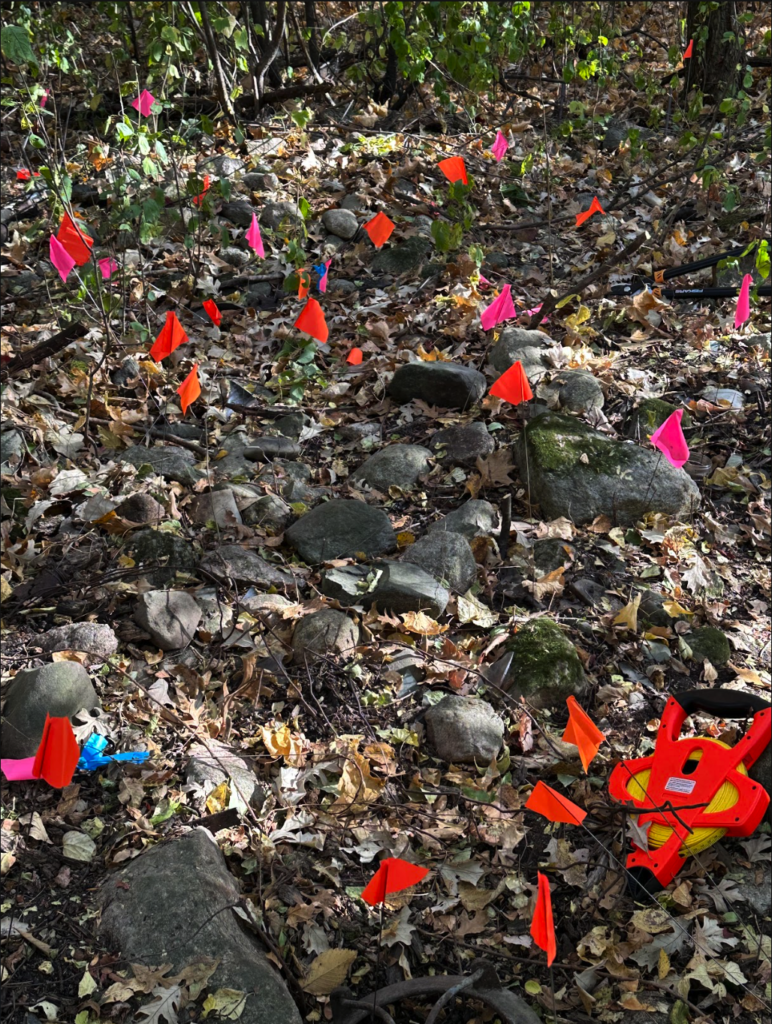
Figure 2: Feature 1. The second trash midden.
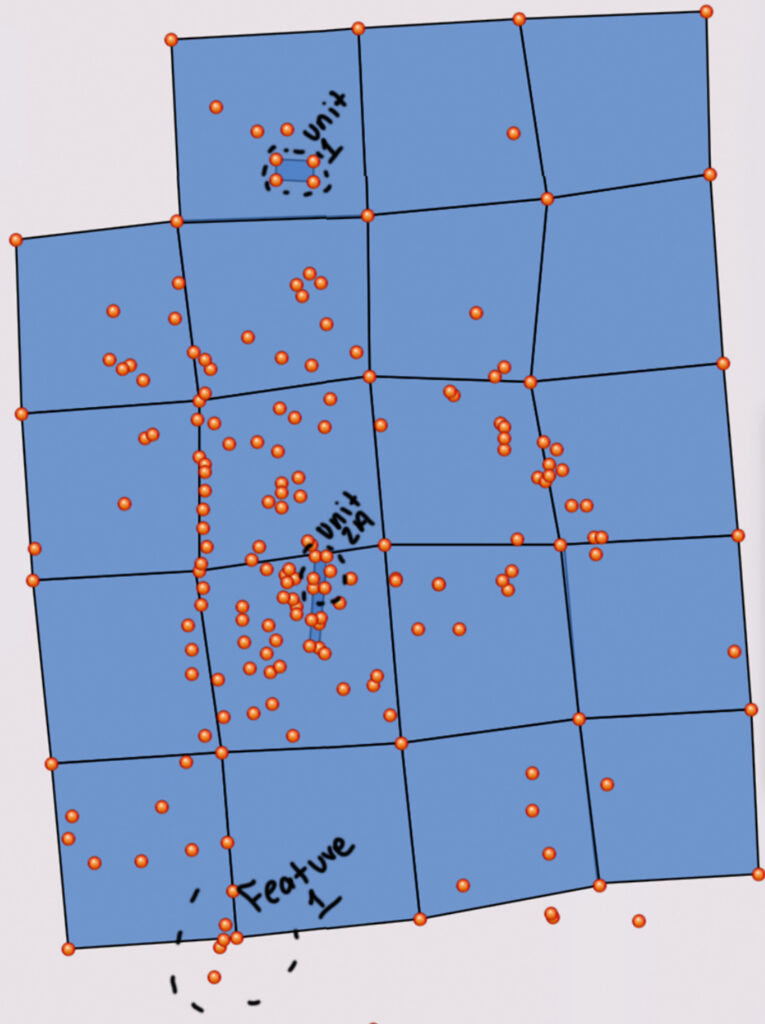
Figure 3: The Map of The Excavation Sites
Methods and Materials
Unit 1. The First Trash Midden:
In the previous weeks, this unit had been excavated. We thought we were just going to sift through the rest of the loose dirt and clean it up. However, students found part of a barrel in this midden (Figure 3). We filled out the excavation form for the start of layer 2 and the end of layer 2. This allows us to see the difference between the start and the finish of the excavation. There were a lot of glass and ceramic pieces within the side of the unit. This ultimately led us to the finding of the barrel.
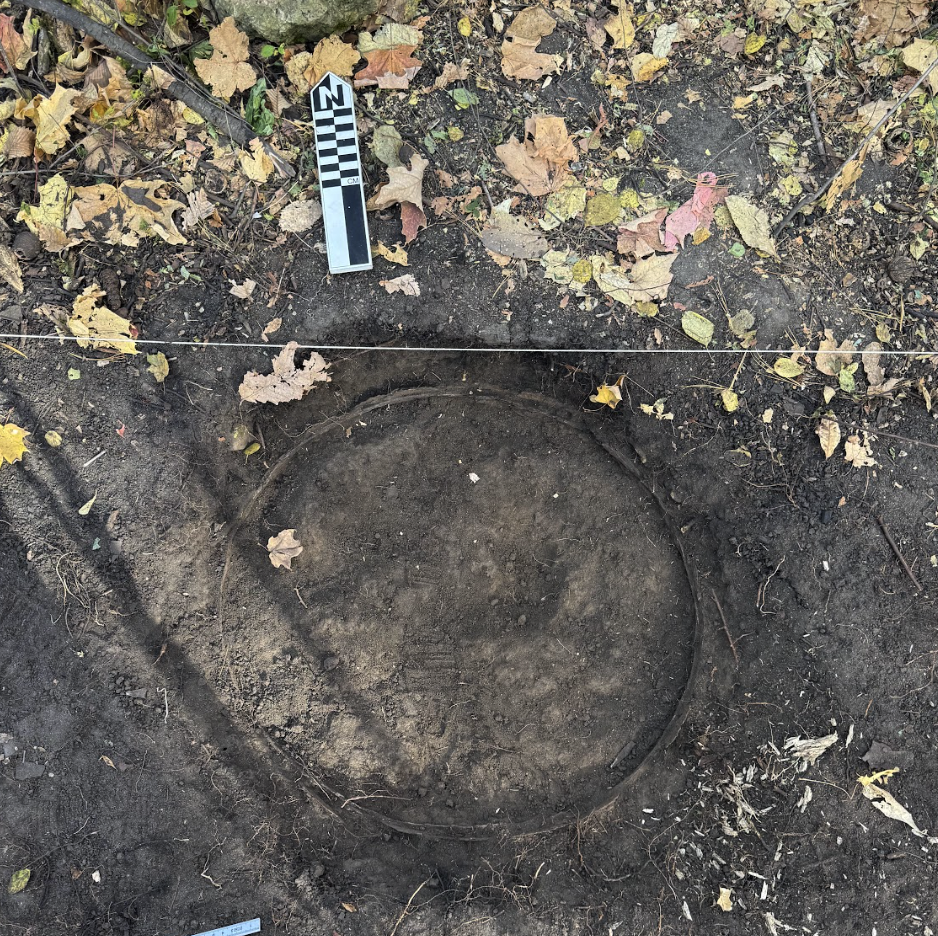
Figure 4: The barrel in Unit 1
Figure 5: The Final Excavation Form from Unit 1.
Unit 2A The Trench:
Excavation of the trench began in Week 5 and continued this week. In Week 5, the excavation went through Level 1 in Context 1. Tuesday’s lab excavated further, expecting to continue excavation by levels, but after getting around 5 cm into Level 2 Context 1, in which we did discover a juvenile bone likely from a cow that had been cut with a saw, we discovered three distinct sections of discolored soil. The main section was a new layer of the trench with yellow, hard-packed, sandy soil that surrounded the two other sections. Those other two sections were pits of dark, moist, fine soil that was loosely packed.
After discussing and weighing the benefits of continuing to dig by level versus switching to digging by context, we decided to begin digging by context. Digging by context simply means that instead of going down 10-20 cm all around and then starting a new level, we will instead dig areas of interest and areas with different contexts or stories to tell. We believed that the yellow sandy soil had a different story to tell than the two other contexts with dark, loose soil.
After discussing and weighing the benefits of continuing to dig by level versus switching to digging by context, we decided to begin digging by context to analyze the stratigraphy of each layer. Using the Munsell Color Chart, we were able to keep notes of the each soil level and their distinct color, beyond just describing them as ‘light’ or ‘dark’. Digging by context simply means that instead of going down 10-20 cm all around and then starting a new level, we will instead dig areas of interest and areas with different contexts or stories to tell. We believed that the yellow sandy soil had a different story to tell than the two other contexts with dark, loose soil.

Figure 6: Excavation into Context B begins.
Contexts B and C were dug out entirely, down to 47 cm below surface level each. After sifting, we found no artifacts in the dirt dug from either context. In this case, finding nothing was somewhat confirmation of our theory, that these two contexts were created from rocks, perhaps from the chimney, that had fallen into the foundation and were later removed and backfilled. This backfill would have been with a different age and type of soil than the rest of the context around, creating the disparity that we see.
Context D was dug out in Thursday’s lab. Context D also had no artifacts in it, and was extremely physically challenging to dig out due to how hard-packed the soil was. Context D was eventually dug out to become level with Contexts A and B, creating a consistent 47 cm depth all around. Context D contained small shards of glass and concrete, but not much else. The initial hypothesis posited by Tuesday excavators was that this context contained chunks of the foundation and that we had perhaps finally found the actual remnants of the foundation of the house. This theory was also supported by testimony from excavators from last year’s lab in which students found similar colored/textured soil and soon after excavating found the foundation of the music hall.
However, after Thursday’s lab excavated down to 47 cm, they did not discover any traces of the original house foundation. We believe that we may still be close to the original foundation, but we will have to keep digging deeper – perhaps another meter.
Feature 1. The Second Trash Midden:
The discovery of a new trash midden, Feature 1, posed new questions for further excavation. The area had numerous artifacts on the ground, such as a large cooking pot (Figure 3), glass bottles, and cans. The large number of artifacts in comparison to the Unit 1 midden led us to hypothesize that this midden may have been a more primary trash location, while Unit 1 was a secondary midden by the fire pit. We discussed whether we should excavate despite the rocky terrain, or try to take a sample of artifacts on the surface. One risk of the sample approach is survey bias. By only sampling artifacts we find significant, we may misrepresent the contents of the midden. A third approach is to take a small excavation sample and extrapolate those findings to the midden as a whole.
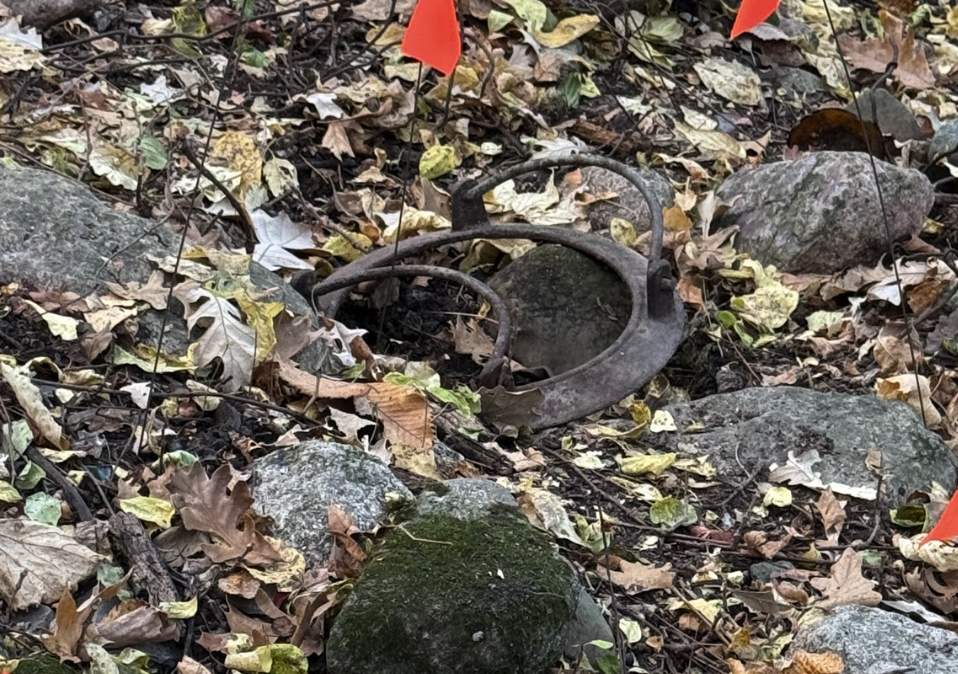
Figure 7: A pot found at Feature 1
We used 3D modeling to scan various items found. Using the Scaniverse app on the Archaeology Program iPad to 3D scan excavation units and a few artifacts we uncovered a barrel from the bottom of Unit 1:
Figure 8: Barrel at Bottom of Unit 1, Level 2 by skenned11 on Sketchfab
We also 3D scanned the trench of unit 2A:
Figure 9: Unit 2A by skenned11 on Sketchfab
And a pot from Feature 1:
Figure 10:Feature 1, Midden 2 by skenned11 on Sketchfab
Using these 3D scans we can get a better idea of the context of these artifacts and features.
Results and Discussion
This lab resulted in many new discoveries for our class. We employed new methods, such as 3D scanning, to gain further context on the barrel in Unit 1, trench unit 2A, and a pot from Feature 1. These scans make our work more accessible to the public online in a 3D format, and allow us to preserve these artifacts and features at a point in time before we continue excavating. Although we only found a few artifacts, following the context of Unit 2A’s stratigraphy provided new archeological evidence of change in the site over time with the animal burrow and loose soil that may have been backfilled. We discovered a third site, Feature 1, with a large quantity of artifacts for us to analyze further. This site suggested that the Women’s League Cabin had several trash pits, with Feature 1 being a more primary midden compared to Unit 1. W Our discussion of how to collect and/or excavate Feature 1 was a key step in determining which archeological methods would be best suited to understanding this midden, and by extension, the Women’s League Cabin as a whole. As we continue with our possibly final excavation lab next week, this week’s findings will be essential in narrowing our focus to key aspects of the Women’s League Cabin.
Week 5 – Excavation at the Women’s League Cabin
By Arthur Koenig
Introduction
Before I began this class, the dominant image of archaeology in my mind was excavation—people in sun hats standing in giant pits, uncovering lost artifacts that will later make their way into the world’s museums. I’ve since learned that excavation is just one method of archaeological work, alongside remote sensing technology, field survey, and more. This week, however, it was time to excavate, so I donned my cap, grabbed my trowel, and began the process of discovering and documenting artifacts at the Women’s League Cabin.
Methods and Materials
The primary focus of excavation on Thursday was the trash midden discovered last week in grid A2. The prevalence of visible artifacts at this site made it a prime and obvious site for excavation this week. One small group began by clearing a path to the site, as it is in one of the most densely covered areas of the Women’s League Cabin site. This may help explain why it wasn’t uncovered in previous surveys of the site back in 2015.
Before (Fig. 2) and after (Fig. 3) we used clippers to make a path to the trash midden:


Next, we began setting up an excavation unit around the midden. We observed where the visible artifacts seemed to extend to, and decided to create a two-meter by one-meter unit. This is where math came into play: after plotting out the nails, we calculated the grid’s hypotenuse. Our nails were a couple of centimeters off, so we adjusted accordingly. Then, we tied string around the nails, and used a mallet to position them further in the ground. Our grid was now drawn and easily visible (Fig. 4).

Then, we began using our trowels to clear dirt and sort artifacts into bags labeled for metal, ceramic, or glass artifacts. We used our trowels horizontally, to avoid digging up the dirt and digging unevenly into different stratigraphic layers. Towards the middle of the unit we found the most artifacts, from small glass shards or pieces of ceramics to mostly whole cans and bottles. As we kept going, Adria uncovered this Coca-Cola bottle (Fig. 5), which the second lab eventually 3D mapped.

Soon enough, we had filled up most of each bag with artifacts, and even had to make a second bag for glass pieces. The most challenging thing about excavating this unit was not sorting through dirt looking for a stray artifact, but rather, keeping track of all of the small artifacts and sorting them in an effective and timely manner. Many of the pieces were difficult to pick up with our gloves on, and to see with the naked eye. As the lab came to a close, we began to screen the dirt that we had cleared, to see if there were any more artifacts to sorted that weren’t originally visible to us. There was a lot of collaboration during this part of the excavation, and we found several more pieces of ceramics and glass, as well as charcoal from a recent burn.

We recorded relevant information about this unit on the Excavation Form. This includes a sketch of the surface of the site, as well as the level, strata, methods, soil description, and a general description of the unit.

Simultaneously, two groups were working with the DA2 antenna to map the artifacts found in previous labs to their precise location. To do this, one partner stood with the antenna at the exact location of an artifact, and balanced it to ensure that it was capturing the most accurate geographical information possible. The other partner, with their device connected to the antenna, marked the location as an artifact (denoted by a star) in our ArcGIS field map, and documented it with a picture and short description. As a result of this work, the data on our ArcGIS field map is much more accurate, dynamic, and complete: the artifacts are mapped precisely, and we can toggle them on and off with the features of the site and the fence, to view them either independent or separate from one another (Figs 8, 9).
A third group was focused on looking at the foundation of the Women’s League Cabin. This first involved a lot of clearing, and setting up a 5 meter by 0.5 meter trench, where we have hypothesized the foundation lies. This group followed the same process as the midden: setting up nails, finding the hypotenuse, and adjusting their position accordingly before tying a string around each nail (Fig. 10). This group cleared six tiles of the porch, and dug the first stratigraphic layer with trowels (Fig. 11), before the second lab later screened this dirt.


Results and Discussion
We also experimented with 3D mapping, using the Scaniverse app on the Archaeology Program iPad to 3D scan excavation units and a few artifacts we uncovered this week from Unit 1. In a matter of minutes, Sam M. was able to generate 3D scans of Unit 1 (Figure 13) and Unit 2 (Figure 14), as well as some artifacts, such as the tin can (Figure 15) and the Coke-a-cola bottle (Figure 16), both found in Unit 1, Level 1. In the future, other students in the class will get the opportunity to continue to 3D map the excavation units as we dig deeper into the ground. Other students may use this technology for their final project, as it is an easy and quick was to scan an artifact and make it viewable on a website.
Figure 13
Figure 14
Trench unit 2. end 10/17 wlc by skenned11 on Sketchfab
Figure 15
Can wlc by skenned11 on Sketchfab
Figure 16
Coca Cola bottle wlc by skenned11 on Sketchfab
We haven’t yet dated each of the artifacts uncovered in this lab’s excavation, but the results could yield fascinating insights into the nature of activities and use of metal, glass, and ceramic materials at the women’s league cabin. Perhaps the bottles that were uncovered were used for alcohol, which, depending on their date, could either be evidence of partygoers in later decades, or some prior clandestine activity at the cabin. Based on the distribution of artifact data (particularly the midden in A2), however, we can infer that the residents of the cabin threw out their trash away from the cabin itself. In the coming weeks, as we uncover more artifacts at the Women’s League Cabin, combined with alumni interviews and continuing work in the Carleton archives, we will have a better understanding of the site itself and of life at Carleton in the twentieth century. This week, we gained crucial insight and experience in a variety of excavation methods, and how to most effectively set up a site, as well as categorize and analyze our findings.
Week 4 – Surface Survey of Women’s League Cabin
Created by: Ella Lefkowicz and Karin Grevstad-Nordbrock
Introduction
This week, we had the opportunity to revisit the Women’s League Cabin in the Carleton Arboretum. Our focus this week was to clear away shrubbery and growth that had accumulated since the last Archaeology Lab investigated this area in 2015. We also began plotting artifacts and features of the site using a GPS and creating a grid of the area we would use to identify and survey the area. In Tuesday’s lab, we split up into two groups of six. One group began working on clearing the area where the Women’s Cabin previously stood so we could begin to see the foundation of the cabin and its surrounding area. The second group set up the two GPSs that we were provided and began plotting artifacts and features that we found surrounding the cabin. Halfway through the lab, these groups switched jobs, and the group in charge of mapping began to create a grid of the area we could refer back to when surveying. In Thursday’s lab, the students split up into groups of two and each pair was assigned a grid to survey the area more precisely. Our main achievements of this week’s labs were the clearing of the cabin’s foundation, creating a grid of the site, and plotting features and artifacts.

Figure 1: Sophia and CJ clearing the area of the Women’s League Cabin
Methods and Materials
To prepare the site for surveying, Tuesday’s lab began by clearing the land, especially the area where the cabin stood and its surrounding space. We used rakes, and gardening clippers of various sizes to cut down vegetation, and we collected large sticks which were then deposited into woodpiles. This helped increase the visibility, making it easier for Thursday’s class to do an efficient survey.
Next, after establishing the boundaries of the site, we laid blue flags to mark the corners of each square plot. After splitting into pairs, we surveyed each plot one at a time, employing the ground survey technique– walking slowly back and forth in straight lines looking for anything that indicated previous human behavior. The artifacts and features we found from this method were then marked with orange flags, and documented on the same survey form as used in week 3. After finishing the survey, each pair of students filled out a sheet showing the number of artifacts found, what category of material they belong to, and information about the conditions of the site, including plot number, visibility, soil type, and cloud coverage. Additionally, we drew rough sketches of the plot which showed the northern orientation, the location of notable artifacts or features, and the general proportions of the plot.
After the site had been thoroughly surveyed, we began to map the site using a d2 archaeological antenna. This tool is comprised of a long rod connected to an electronic gadget that uses remote sensing techniques including ground-penetrating radar to capture coordinates using nearby satellites. To use the technology, we stuck the rod into the ground at the places we had previously flagged and used the leveling tool to ensure it was perpendicular to the ground. After repeating this many times, we could more accurately represent the location of notable landmarks on the site, such as the barbed wire fence shown in many of the maps below.
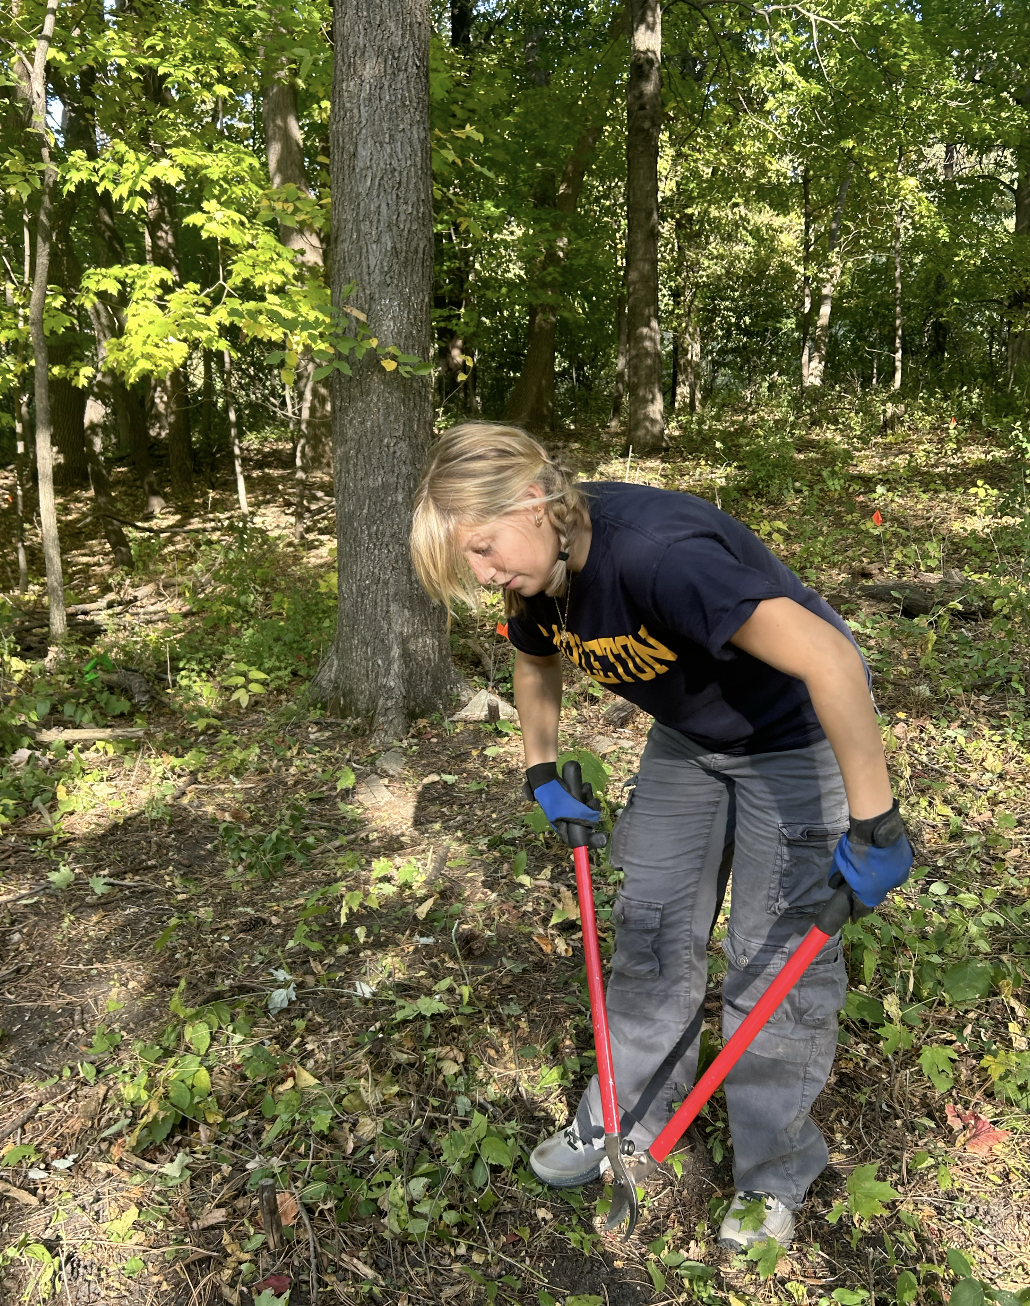

Figure 2 and 3 (respectively): Bridget cutting overgrowth; Max and Becca raking the patio area
Results and Discussion:


Figures 4 and 5: Grids of the Women’s League Cabin categorized by concentration of features and artifacts (respectively)
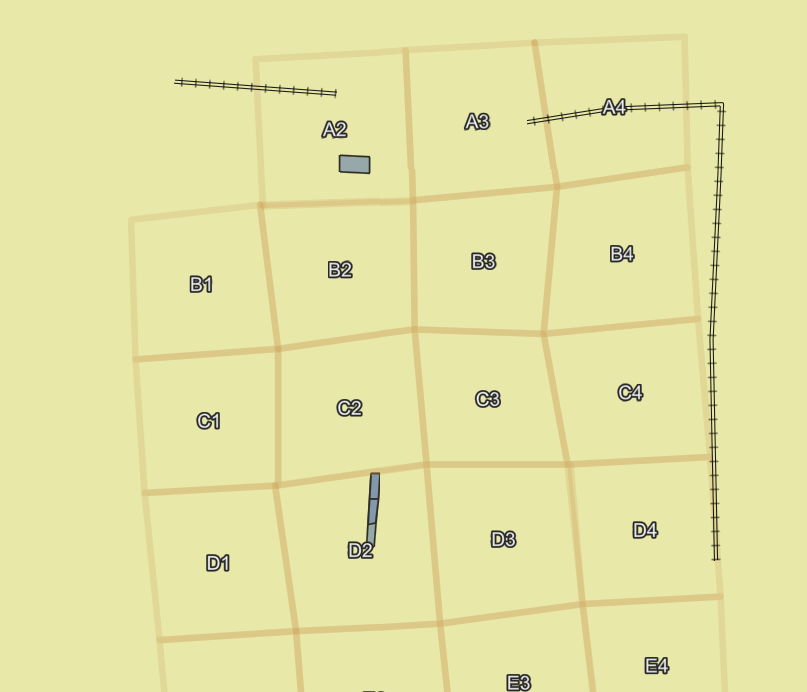
In Figure 4, we can see the features found in both the Tuesday and Thursday labs, distinguished by the concentration of features in each plot, with the darker color indicating more features found. While this is an incomplete graph as we have yet to finish surveying the land, we can begin to notice a more concentrated area of features in plots B2, C2, D3, and D4. This illustrates the cabin’s patio foundation and walkway laying in plots B2 and C2 and the remnants of the cabin in plot D3.
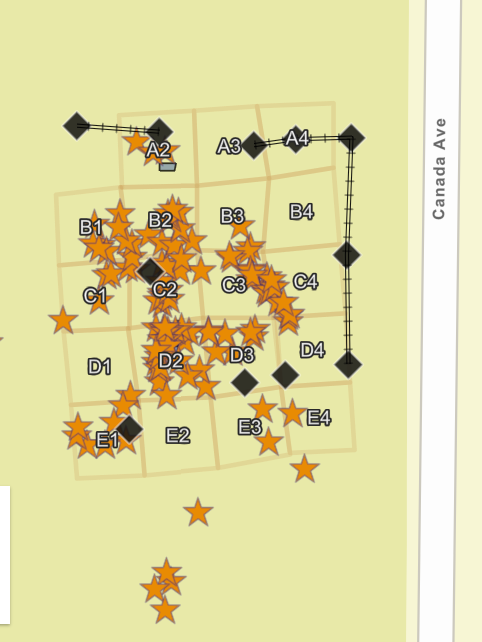
Figure 5 shows a notable overlap between the concentration of artifacts and the varying concentration of features found in Figure 4. As seen in the map key of both Figures 4 and 5, 14 artifacts constitute a high concentration of artifacts in Figure 5 while in Figure 4, the most features found in a plot is 3. This is not a surprising finding as artifacts are more common than features, especially in an area of recent human traffic like the Women’s League Cabin. The high concentration of artifacts in plots C2, D2, and D3 is predictable as it is a clearing where people would likely congregate in the years following the demolition of the Cabin and where remaining artifacts, such as bricks, could be found from the Cabin. Plot A2 shows a pile of artifacts found during Thursday’s lab. We believe these to have been discarded by the Women’s League when they were in possession of the cabin during the 1930s-1960s (expanded on in Figure 6 and its description).


Figure 6: Grid and key of the Women’s League Cabin artifacts divided by material
With Figure 6, we are able to confirm our conclusions about the uses, both past and modern, of plots C2, D2, and D3. The large proportion of brick in these plots indicates that this space was where the cabin previously stood, with the bricks likely being forgotten debris. Additionally, a good amount of plastic is found in these same plots. As plastic only began to gain popularity in mainstream use in the 1960s and 70s, the larger proportion of plastic in plots indicates a more modern use of this area, especially in the plots where the cabin stood. Similarly, you can see a lot of glass, ceramics, and metal found in plot A2, where the pile of artifacts was found. In addition to the lack of plastic, the distance from the cabin indicates that this area was used less recently, most likely as a place for those using the cabin to discard garbage. We know from the Olin Farm and other areas in the Arboretum that before the advent of a centralized trash collection system, people often discarded their trash off to the side of their houses, as seen in plot A2.

Figure 7: The high concentration of artifacts found by Thursday’s lab in plot A2
This week, we realized the importance of looking further into our findings, beyond labeling them as artifacts or features and distinguishing them by specific material, where they were found, and in what condition. This makes it possible to look at two plots with similar concentrations of artifacts and realize their vastly different purposes, as seen in plots A2 and D2. While there is still much to learn about the specific uses of the Women’s League Cabin, we will continue looking at everything we find with a more detailed eye, knowing that it is the context that makes the difference between indescribable findings and findings that can improve and deepen our understanding of the bigger picture.
Week 3 – Survey of Arb Prairieland
Created by: Becca Madsen, Shreya Mehta, Bridget Foley
Introduction
This week we visited a portion of the Arb prairie to practice surveying methods we had been studying in class. Our area of interest was divided up into four quadrants, two quadrants were closer to the walking trail (referred to as Grid A and B) and two that were closer to Highway 19 (referred to as Grid C and D). The students were divided into 2 groups of around 6 people and each group was assigned to one grid square to survey (Figures 1 and 2).
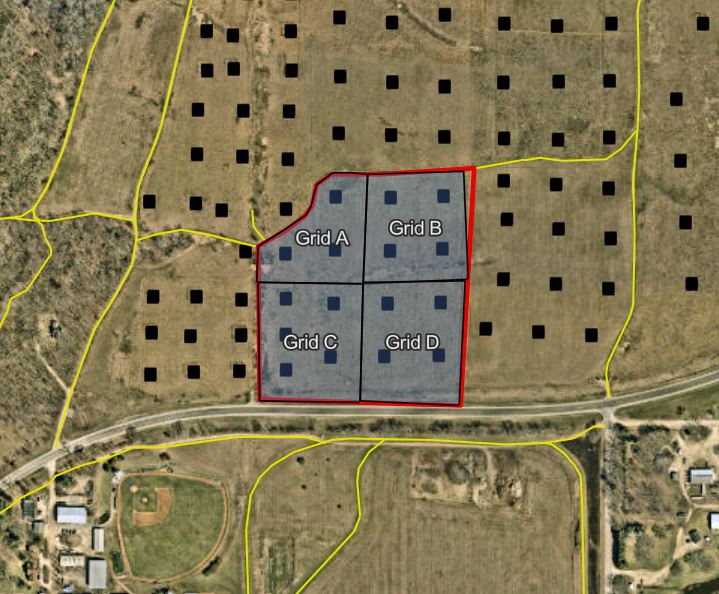

Figure 2: Students survey Section B using pin-flags to mark artifacts.
To conduct the survey, each student was placed roughly 10 meters apart (Figure 3). Students attempted to walk at a similar pace as their teammates while surveying the ground immediately in front of them as well as 1 meter to the left and right. Any artifacts were marked with pin-flags and then marked on ARCGIS after the entire quadrant had been surveyed. When marking on ARCGIS we made sure to include photos with an item to indicate scale (pencil). We found plastic fibers, pieces of perlite, brick, charcoal and tractor tire tracks within the four quadrants of prairie land.

Figure 3: Students shown in their survey lines, roughly 10 meters away from each other
Methods and Materials
We conducted an on site surface survey in which our group (consisting of 6 people) conducted a field walk on Grid A of the survey area.
A surface survey is conducted through visually examining the surface of the ground to determine indications of archaeological sites or features. Each student in our group was spaced approximately 10 meters apart, walking at a similar pace as their fellow students while surveying the ground in front of them as well as one meter to the left and right. We were provided with compasses which allowed us to determine the direction we were walking in. Each group member was provided with 15 flags, and 2 groups members were denoted as a picture-taker and a note taker. These members were responsible for recording our observations and finds through a survey form and various images (Figure 4).

Figure 4: 3 students record artifacts found on their survey sheet and on ARCGIS
Artifacts or any features of note were marked with neon pin flags, which we then reviewed as a group and marked on a digital map as well as on the survey sheet. The ground was filled with prairie grass, about ankle height, and covered with compact soil which made visibility of certain artifacts a little bit harder. We completed the survey under cloudy and slightly windy conditions which could have also contributed to a slight shifting of objects on the site.
Results and Discussion
In total, we found 28 artifacts and features, 6 in Section A, 13 in Section B, 7 in Section C, 2 in Section D. Strictly in terms of artifacts, there were 4 in Section A including paper (1), botanical (1), brick (2) and other (2). In Section B we found 4, plastic (2), botanical (1), and other (1). Section C recorded tire tracks as well as a rock. Section D found a sprinkler system and brick. These findings are shown in Figure 5 which is a map that recorded the points where artifacts and features were found. Section B had the highest density of artifacts and features. This went against our initial hypothesis that Sections C and D would boast more artifacts due to its proximity to Highway 19. Across all the grids we recorded the feature of tire tracks likely due to the control burns in this area. Overall, we were surprised by how little artifacts we identified in the Arb, especially after easily finding evidence of human activity at our previous visit to the Women’s League Cabin.

Figure 5: Total Artifact count by grid
From Figure 5 we can see that the most artifacts were concentrated in Grid A with the least in Grid C. This tells us that there was a lot of human activity by Grid A which also happens to be the closest to the walking path. We can infer that the proximity of the path to the high concentration of artifacts is connected. Grid C has the least artifacts possibly for the same reason we believe it would have the most. It’s the closest to a relatively highly trafficked highway so it is unlikely people will walk on the side of the road and thus would not have the opportunity to leave things behind.

Figure 6: Tire Track Locations by Grid
From Figure 6 we can see the tire track locations by grid which were mainly concentrated in grids B and C. From the recorded data, we hypothesize that since this area of the arb was subject to a controlled burn, these two grids could’ve been the starting point for each horizontal row. In lab one, we were told that controlled burns in the arb are completed in many small horizontal sections , which means tractors would not need to be driven on both grids to start the fire. The tire tracks in grid B could be caused by a lack of vegetation post burning, causing the ground to be a bit more susceptible to tire imprints, and we assume the same is true for Grid C (although our lab section did not survey the area). Although this hypothesis is plausible given the data we have, some groups did not record all tire tracks, as they are features and not artifacts. This may mean we were missing out on a pattern of burns that could have occurred, or a specific route the trucks could have taken through the arb. Thus, there is still a possibility of a different track pattern.

Figure 7: Map of Artifacts found (categorized by plastic quantity)
After we returned to the classroom, Tuesday’s lab section was introduced to the ARC GIS website, where we were able to add indicators of how concentrated certain artifacts were in each grid, as well as the density of the points. Figure 1 shows that the concentration of plastic artifacts were consistent in all grids except for grid A. In addition, this map visualizes the proximity of points per grid.
After we returned to the classroom, Tuesday’s lab section was introduced to the ARC GIS website, where we were able to add indicators of how concentrated certain artifacts were in each grid, as well as the density of the points. Figures 5 & 6 give more insight into the concentration of human activity, as well as why humans may or may not have inhabited each space. Figure 7 shows that the concentration of plastic artifacts were consistent in all grids except for grid A. In addition, this map visualizes the proximity of points per grid. Overall, both lab sections were surprised by the lack of artifacts (perhaps due to the frequency of prairie burnings), especially the grids near the highway, where we hypothesized that there would be more tracks. Although we were discouraged by what we thought was a lack of data, we came to realize that “a lack of data is still data”. In reality, the small number of artifacts causes us to question why humans may not be in this area, which could be attributed to factors such as the prairie burns discussed earlier.
Week 2 – Grand Meadow Chert Quarry site visit
Created by: Lucas Heldman, Charlie Rhodes, and Calla James Ruff
Introduction
The purpose of this lab was to learn about the history of the native peoples within Minnesota while engaging with archaeology and site preservation in the local community. Grand Meadow (or Wanhi Yukan in Dakota, which roughly translates “there is chert here” ) Chert Quarry was in operation for thousands of years, and had an estimated 2,000 pits dug for chert, of which a very small minority have survived until today.
Chert played a vital role in Native American daily life, as it was the material from which a large number of their tools were made. Grand Meadow Chert was special in this regard, as it was found in nodules which prevented its being formed into larger implements, while also being of extremely high quality.
In our time at Grand Meadow Chert Quarry we worked with volunteers to clear out several of the pits and transport gravel in order to help to prepare the site to be opened to the public in spring of 2025.
Materials and Methods
Our lab day began with time to explore the Mower County Historical Society’s museum exhibit. This exhibit featured large maps of this area of southeastern Minnesota at various points in time, as well as many samples of found arrowheads, hammer stones, anvil stones, and more. There was even a spot where you could pick up and touch a few pieces of chert to get a sense of what native peoples were working with and handling.

Display at Mower County Historical County Museums of Grand Meadow Chert Scrapers
We then received a lecture from archaeologist Tom Trow. Trow gave us a rundown on the history of native groups in the greater area, from Grand Meadow all the way to modern-day Illinois, and how chert played into this. He explained that chert was initially found in nodules loose in a creek, but as that ran low, people began digging next to the creek, only needing to dig a little to find more chert. They continued this pattern for 8,000 years, going a bit farther up a hill and digging deeper each time to reach the level the chert was at. We heard about the Cahokia people, who painstakingly built a large flat-top mound by using baskets to move the dirt around. The mound was used in many ceremonies by the Cahokia people, who had a substantial belief base. However, since this only lasted about 300 years, it would be considered a cult rather than a religion.
Separately, different groups would use buffalo hides for trading, keeping many more than they needed at any given time. Chert was crucial for this practice, however—the hides had to be scraped clean, and Grand Meadow chert scrapers were the best tool for the job.
Interestingly, Grand Meadow Chert Quarry was most likely also a social meeting place. The tribes that sourced their chert from there often were small enough that marriage prospects were low for young members—many people were related to each other. As a result, tribes might have planned meeting times during the warm months so as to give young people the opportunity to meet potential life partners.
Much later, when white farmers came into the area, some would try to fill in the holes dug for chert, but could not for it was too big of a job to be worth it. This gives a sense of scale as to how much digging and work went into this site—it would not easily be undone.
After the lecture, we went to the quarry itself. We enjoyed lunch and a tour of the site from Trow, who talked about what goes into turning a space like this one into a usable archaeological site, as well as a publicly accessible outdoor space.

Tom Trow talking to students about the process of making this site accessible and public.
Led by Marcy Averill, Carleton’s Indigenous Communities Liaison, we were given the space to make a tobacco offering to the ancestors and fore-bearers of the quarry. We each took a pinch of tobacco and one by one laid it at the base of a Grandmother burr oak that has been there for hundreds of years.
We then commenced our manual labor. There were well-made and wheelchair-accessible paths through the whole site, and one group of students worked to reinforce these with more gravel.

Gravel path through the quarry.
The other groups of students cleared three pits across three groups. Using work gloves and clippers, we worked to remove all plants from the pits. There was significant bramble, which proved difficult to remove entirely, as well as various greenery and a few larger logs. One of the volunteers who led our efforts had a chainsaw that was used to cut these logs into more manageable sizes before we hauled them off to a designated pile nearby.

Students working to clear pits to increase visibility.
By the end, the pits were completely cleared out and ready for viewing and/or archaeological research.

Tom Trow standing in a cleared-out pit, mapping a found anvil/hammer stone.
We left the site feeling good about the work we had done, excited about the future of community archaeology at the quarry.
Findings and Results
Clearing out the pits of natural debris and plant life to make it more visible and accessible demonstrated a part of the archaeological process not often remarked upon. There is a large amount of work to be accomplished before an excavation can be begun. The manual labor involved in site clearing is only one of many tasks, which include writing grants and gathering funding for the project, both of which are lengthy processes that take a great deal of effort.
While clearing out the pits was not intended to find any artifacts, we did manage to find what we believe to be either an anvil stone or a hammer stone in one of the pits. Anvil and hammer stones were used by the Indigenous people of the quarry to break open the dug up nodules of chert to examine the quality of the chert inside and decide whether or not it was worth making scrapers or other tools out of. One would repeatedly hit the chert nodule resting atop the anvil stone with the hammer stone to try to make it break and reveal the chert inside.

Hammer or anvil stone with human-made indent visible.
The Wanhi Yukan Chert Quarry is expected to open to the public as a self guided tour site in the spring of 2025, and as program director Tom Trow made clear, it is not only an important historical and archaeological site, but also a beautiful place for simply walking around and getting outdoors. More information can be found on the Mower County Historical Society website, linked here.